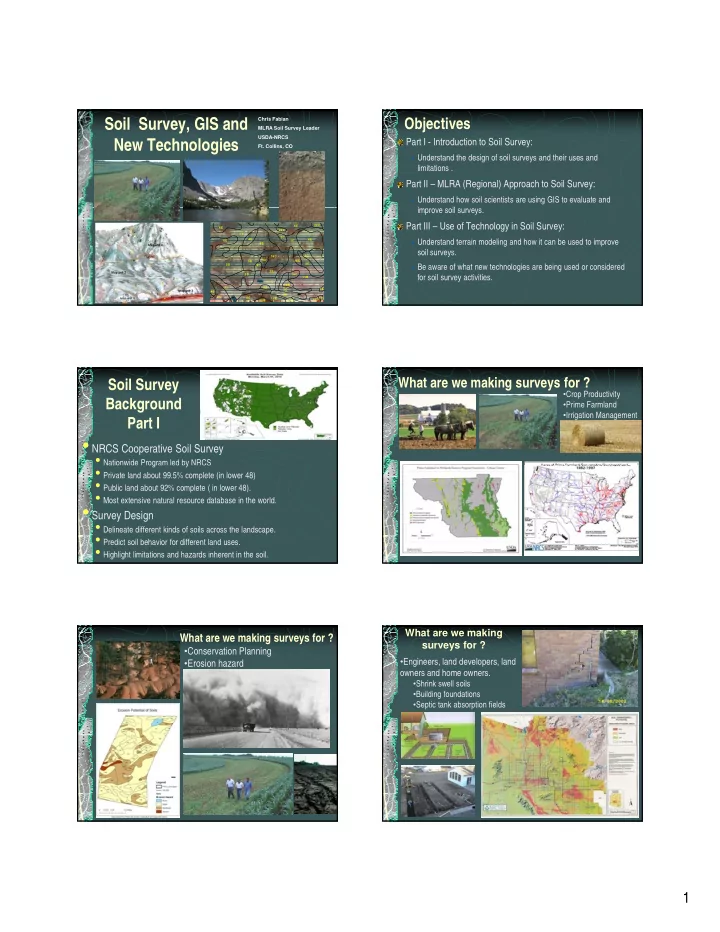
soil series soil series
play

Soil Series Soil Series Understanding Soil Understanding Soil - PDF document

Soil Survey, GIS and Chris Fabian Objectives MLRA Soil Survey Leader USDA-NRCS New Technologies Part I - Introduction to Soil Survey: Ft. Collins, CO Understand the design of soil surveys and their uses and limitations . Part II


  1. Soil Survey, GIS and Chris Fabian Objectives MLRA Soil Survey Leader USDA-NRCS New Technologies Part I - Introduction to Soil Survey: Ft. Collins, CO  Understand the design of soil surveys and their uses and limitations . Part II – MLRA (Regional) Approach to Soil Survey:  Understand how soil scientists are using GIS to evaluate and improve soil surveys. i il Part III – Use of Technology in Soil Survey: 6E 22C 6E 22C 1C 2C 4E 6E  Understand terrain modeling and how it can be used to improve 6E 1C 6E soil surveys. 16C 2C 3E 3D 16C 5D 3E  Be aware of what new technologies are being used or considered 8D 3E 3D 16C for soil survey activities. 11B 11C 16B 33 8D 3D 16 8E 25 2C 8E 16E 16D12C 13B 13D What are we making surveys for ? Soil Survey • Crop Productivity Background • Prime Farmland • Irrigation Management Part I • NRCS Cooperative Soil Survey • Nationwide Program led by NRCS g y • Private land about 99.5% complete (in lower 48) • Public land about 92% complete ( in lower 48). • Most extensive natural resource database in the world. • Survey Design • Delineate different kinds of soils across the landscape. • Predict soil behavior for different land uses. • Highlight limitations and hazards inherent in the soil. What are we making What are we making surveys for ? surveys for ? • Conservation Planning • Engineers, land developers, land • Erosion hazard owners and home owners. • Shrink swell soils • Building foundations • Septic tank absorption fields 1

  2. Mitigating or What are we making Preventing surveys for ? Environmental Problems Land-use planners What are we making surveys for ? Area and depth weighted (All components and horizons) • Federal and State Agencies Scientist – demand for data such as soil • Govt. and Private Forests organic carbon • Fire management and restoration • Water Supply and Flood forecasting Soil Series Soil Series Understanding Soil Understanding Soil Surveys & Map Units Surveys & Map Units •A group of soils that have horizons similar in arrangement and in •Our standard detailed Soil Survey Product is SSURGO differentiating characteristics. (Soil Survey Geographic Database) data. This is •Soil Series are allowed to have a range analogous to the detailed maps in our standard hard of properties but look and behave of properties but look and behave copy soil surveys. similarly. •SSURGO data divides the landscape up into soil Example - Chippewa Series mapping units. Classification - Fine-loamy, mixed, •Soil Series are the basic building blocks of soil mapping active, mesic Typic Fragiaquept units. 2

  3. Map Units Map Units Map Units Map Units – – 2 types are most common 2 types are most common Consociations Consociations Subsections of the landscape Subsections of the landscape Mostly one soil series, but Each may be made up of one or more soil series may include other soil series if they are similar and do not limit the land use These uniform areas are These uniform areas are examples where examples where examples where examples where consociations may occur consociations may occur Complexes Complexes two or more dissimilar soil series occurring in a regular, repeating pattern but each is too small to be separated at the map scale Soil Survey Maps Soil Survey Maps show delineations of landscape show delineations of landscape Soil Surveyors delineate landscapes segments from a vertical, 2- segments from a vertical, 2 -dimensional viewpoint dimensional viewpoint into Map units 1C Edneytown-Saurtown Complex, 8 to 15 % slopes, Very Stony 33E Peaks-Ashe-Edneyville Complex, 25 to 45% slopes, Very Stony 11A Comus-Maggodee Complex, 0 to 4 % slopes, Occasionally Flooded 39C Wintergreen loam, 8 to 15% slopes Map Scale Map Scale Determines whether adjacent but different soils can be separated into different delineations. Minimum delineation size is about 1/16 sq. in on the original base map:  5.7 acres on 1:24,000 scale maps  4.0 acres on 1:20,000 scale maps  2.5 acres on 1:15,840 scale maps  1.4 acres on 1:12,000 scale maps Additional consideration is the “order of mapping. 1C  Order 1 – intensive, not generally published. 33E  Order 2 – moderately intensive, eastern Colorado.  Order 3 – less intensive, forest service lands, deserts, mountainous areas.  Order 4 - Remotely sensed with occasional field verification. 11A The legend, map unit type, and delineation boundary are presumed accurate at the original scale ONLY! 39C 3

  4. NOTE: enlarging the scale (for example, going Can you spot the problems by Map Scales Map Scales Map Scales Map Scales from 1:24000 to 1:8000) after mapping is this procedure? complete gives a false impression that the soils were mapped at the new (larger) scale 1:6000 1” = 500’ Conversion to MLRA MO6-5 Regional Approach to Soil Update Process Survey Traditionally, Soil Survey was Part II carried out on a county-by- county mapping process. John Kari Over the last 5 years, we have Objectives Norman converted to managing soil g g Sever surveys regionally by MLRA’s Understand how we are executing soil survey (Major Land Resource Areas). activities in the future with a MLRA-based (geo- Ft. Collins Office - staffing: landform approach). Chris Fabian Understand how soil scientists are using GIS to Kari Sever evaluate and improve soil surveys. John Norman SSURGO Databases Conversion to MLRA Update Process – cont. SSURGO (Roughly 99% private lands mapped MLRA boundaries are the spatial framework because and about 92% of public lands) they are areas of relatively similar soils, geology, climate, vegetation, wildlife, and land use. • The new MLRA process allows us to: Increase cost efficiency Increase cost efficiency Improve productivity by working across large areas specialize in soils of one or two regions Develop products that are consistent across political boundaries. More easily implement new technologies related to GIS, landscape modeling, remote sensing, etc. 4

  5. Area 6-5 with MLRA’s Soil Survey Area 6-5 shown with county and MLRA boundaries. MLRA’s Northern part of MLRA’s 48A (Southern Rocky Mountains) 48B (Southern Rocky Mountain Parks) Parks) Northern Part of 49 (Southern Rocky Mountain Foothills) Acres  48A: 11,817,000  48B: 1,486,000  49: 4,878,000  Total: 18,181,000 Relative Age of Surveys for the 6- MO6-5 Evaluation 5 region. Castle Rock, Boulder and Chafee-Lake area are the oldest published surveys. Black line is MO6-5 boundary. MLRA boundaries in yellow. Also looking at the number of series used per survey area and the number map units p used per survey area to assess the detail of mapping. 5

  6. Interpretations– Are they consistent across Slope – are our soil surveys mapping slope county boundaries? gradient correctly? Map Unit Distribution Use of Technology in Soil Use of Technology in Soil Using Arc to identify map units in MLRA 105 with “Fayette” as a component Survey Survey Part III Part III • Use of GIS for terrain modeling & predictive mapping. • Soil Drainage Model • Evaluation of Slope Products • Imagery • Soil Mapping Equipment • Tablets, PDA’s and Pen Technology. • Temperature, Moisture and Water Table Monitoring. • Geophysical Tools DIGITAL TERRAIN MODEL MLRA Regional Map MLRA Regional Map (DTM) DEVELOPMENT  Digital Elevation Models (DEM) - The spatial distribution of elevation. Examples include the USGS DEM’s.  Terrain Attribute – An ordered array of numbers that  Terrain Attribute – An ordered array of numbers that represents the spatial distribution of a particular terrain feature such as slope or curvature.  Digital Terrain Models (DTM). A representation of terrain attributes combined to predict the spatial distribution of geomorphic, pedologic, or other environmental features.  MLRA 140 MLRA 140 – – Glaciated Allegany Plateau and Catskill Mountains. Glaciated Allegany Plateau and Catskill Mountains. Examples include a landform model, soil drainage model or  Target Update/Maintenance Project: Susquehanna County, published in 1973. Target Update/Maintenance Project: Susquehanna County, published in 1973.  Field sheet scale 1:15,840 Field sheet scale 1:15,840 surface thickness model.  Publication scale 1:20,000 Publication scale 1:20,000 6

Download Presentation
Download Policy: The content available on the website is offered to you 'AS IS' for your personal information and use only. It cannot be commercialized, licensed, or distributed on other websites without prior consent from the author. To download a presentation, simply click this link. If you encounter any difficulties during the download process, it's possible that the publisher has removed the file from their server.

Recommend


More recommend