SLIDE 1 Color Representation
- 3 Dimensional Perceptual Color Space
- Munsell Color System
- CIE-XYZ Tri-stimulus Coordinate system
- CIE Chromaticity Diagram
- Perceptual vs Linear Color Spaces
- CIE - Lab/Luv Color Space
- Opponent Color Space
- YIQ Space
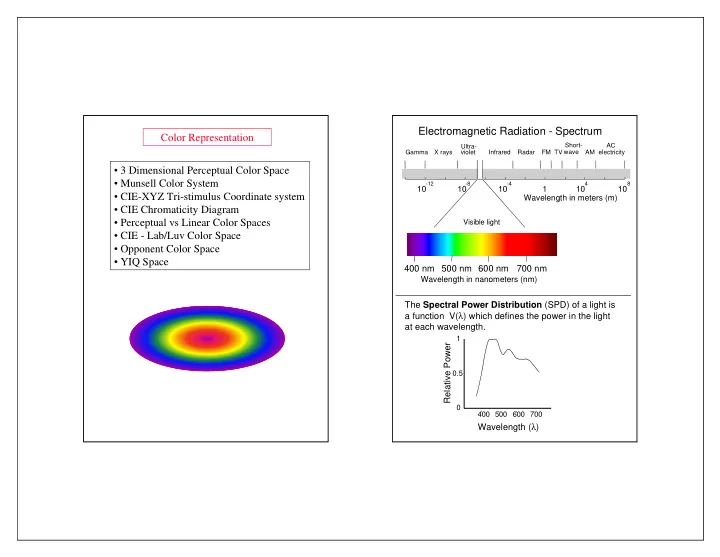
Electromagnetic Radiation - Spectrum
The Spectral Power Distribution (SPD) of a light is a function V(λ) which defines the power in the light at each wavelength. Wavelength (λ)
400 500 600 700 0.5 1
Relative Power
Gamma X rays Infrared Radar FM TV AM Ultra- violet
10
10
10
10
4
1 10
8
electricity AC Short- wave
400 nm 500 nm 600 nm 700 nm
Wavelength in nanometers (nm) Wavelength in meters (m)
Visible light
SLIDE 2 Examples of Spectral power Distributions
Blue Skylight Tungsten bulb Red monitor phosphor Monochromatic light
400 500 600 700 0.5 1 400 500 600 700 0.5 1 400 500 600 700 0.5 1 400 500 600 700 0.5 1
126 14 111 36 36 111 36 111 36 12 12 17 17 111 14 126 17 36 12 111 36 36 200 12 14 126 17 36 36 111 12 14 36 36 200 12 14 126 17 36 36 111 36 200 200 12 14 111 14 126 126 17 36 36 36 36 12 14 111 111 36 126 17 36 36 200 111 72 72 12 12 17 10 128 36 17 200 111 12 14 126 126 126 126 17 17 17 17 36 36 36 36 36 200 200 200 12 12 12 14 14 111 111 72 72 72 106 155
10 128 36 17 200 111 12 14 126 126 126 126 17 17 17 17 36 36 36 36 36 200 200 200 12 12 12 14 14 111 111 72 72 72 106 155 14 126 17 36 36 111 36 200 200 12 14 111 14 126 126 17 36 36 36 36 12 14 111 111 36 126 17 36 36 200 111 72 72 12 12 17 126 14 111 36 36 111 36 111 36 12 12 17 17 111 14 126 17 36 12 111 36 36 200 12 14 126 17 36 36 111 12 14 36 36 200 12
Rgb Image
SLIDE 3 Trichromatic Color Theory
Thomas Young (1773-1829) -
A few different retinal receptors operating with different wavelength sensitivities will allow humans to perceive the number of colors that they do. Suggested 3 receptors.
Helmholtz & Maxwell (1850) -
Color matching with 3 primaries.
Trichromatic: “tri”=three “chroma”=color color vision is based on three primaries (i.e., it is 3 dimensional).
Color Matching
Color Matching - behavioral basis for color representation. Metamer - two lights that appear the same
- visually. They might have different SPDs
(spectral power distributions).
400 500 600 700 400 800 400 500 600 700 100 200
Wavelength (nm) Power
The phosphors of the monitor were set to match the tungsten light. Tungsten light Monitor emission
SLIDE 4 +
match
Color Matching Experiment
Three primary lights are set to match a test light.
= ~
400 500 600 700 0.25 0.5 0.75 1 400 500 600 700 0.25 0.5 0.75 1
Test light Match light
The Human Eye
Optic Nerve Fovea Vitreous Optic Disc Lens Pupil Cornea Ocular Muscle Retina Humor Iris
SLIDE 5 The Human Retina
light rods cones horizontal amacrine bipolar ganglion
Cones - Wavelength (nm) Relative sensitivity
Retinal Photoreceptors
Cone Spectral Sensitivity
400 500 600 700 0.25 0.5 0.75 1
- High illumination levels (Photopic vision)
- Less sensitive than rods.
- 5 million cones in each eye.
- Only cones in fovea (aprox. 50,000).
- Density decreases with distance from fovea.
- 3 cone types differing in their spectral
sensitivity: L , M, and S cones.
L M S
SLIDE 6 3D Color Spaces
R G B Brightness Hue black-white red-green blue-yellow
Cubic Color Spaces Polar Color Spaces Opponent Color Spaces
Color Representations
(Munsell, HLS, HSV)
(RGB, XYZ)
(Luv, Lab)
(YIQ)
(CMYK)
SLIDE 7
Hue Saturation Brightness Black White R G B
Color Description
Hue (red, green, yellow, blue ...) Saturation (pink,bright red, ....) Lightness (black, gray, white ....)
Munsell Color System
Equal perceptual steps in Hue Saturation Value. Hue: R, YR, Y, GY, G, BG, B, PB, P, RP (each subdivided into 10) Value: 0 ... 10 (dark ... pure white) Chroma: 0 ... 20 (neutral ... saturated)
/2 /4 /6 /8 /10 1/ 5/ 10/
Value
5R 10R 5YR 10YR 5Y 5PB 10PB 5P 10P 5RP 10RP 10B 5B 10GB 5GB 10G 5G 10GY 5GY 10Y
/2 /4 /6 /8 /10
Example: 5YR 8/4
SLIDE 8 Munsell Book of Colors HSV/HSB Color Space
HSV = Hue Saturation Value HSB = Hue Saturation Brightness
red 0° green 120° yellow Blue 240° cyan magenta
V
black 0.0 1.0
H S (Smith ‘78) HLS = Hue Lightness Saturation
HLS Color Space
red 0° green 120° yellow Blue 240° cyan magenta
V
black 0.0 0.5
H S
TekHVC = Hue Saturation Chroma (Luv)
SLIDE 9
Linear Color Spaces
Colors in 3D color space can be described as linear combinations of 3 basis colors.
a• + b• + c• =
The representation of : is then given by:
(a, b, c)
Stiles & Burch (1959) Color matching Experiment. Primaries are: 444.4 525.3 645.2 10 deg field.
Given the 3 primaries, we can describe any light with 3 values (CIE-RGB):
400 500 600 700 1 2 3 Wavelength (nm) Primary Intensity (85, 38, 10) (21, 45, 72) (65, 54, 73)
Choose 3 primaries as the basis SPDs.
CIE-RGB
SLIDE 10
CIE Color Standard - 1931
CIE - Commision Internationale d’Eclairage XYZ tristimulus coordinate system. 1931 - defined a standard system for color representation.
X Y Z
(55, 46, 10) (39, 41, 72) (63, 56, 73)
Given the 3 primaries, we can describe any light with 3 positive values (CIE-XYZ):
RGB to XYZ
RGB to XYZ is a linear transformation
0.490 0.310 0.200 0.177 0.813 0.011 0.000 0.010 0.990 R G B X Y Z =
R = monochromatic primary 700nm G = monochromatic primary 546.1nm B = monochromatic primary 435.8nm
(Primaries are normalized so that equal amounts are required to match equal energy illuminant E).
(from Jain)
SLIDE 11 CIE Chromaticity Diagram Y X+Y+Z Y = y X X+Y+Z X = x
x
650 610 590 550 570 600 580 560 540 505 500 510 520 530 490 495 485 480 470 450
1.0 0.5 0.0 0.5 0.9
y
0.0
x+y+z = 1 A common representative of color signal: [x,y,Y] Z X+Y+Z Z = z
y x
650 610 590 550 570 600 580 560 540 505 500 510 520 530 490 495 485 480 470 450
1.0 0.5 0.0 0.5 0.9 green yellow- green yellow
red magenta purple blue cyan white pink
Color Naming
SLIDE 12
0.2 0.4 0.6 0.8 0.2 0.4 0.6 0.8
C B A D65 20000 10000 8000 7000 6000 5000 4000 3000 2000 E
Blackbody Radiators and CIE standard Illuminants CIE Standard Illuminants: A - tungsten light B - Sunset C - blue sky D65 - Average daylight E - Equal energy white (x=y=z=1/3)
x y 0.2 0.4 0.6 0.8 0.2 0.4 0.6 0.8
G1 R1 B1 B2 R2 G2
C E D65
PAL NTSC
Television Primaries and Gamut R G B - Primaries used for PAL R G B - Primaries used for NTSC
1 1 1 2 2 2
C - reference white for NTSC D65 - reference white for PAL
x y