
SLIDE 1
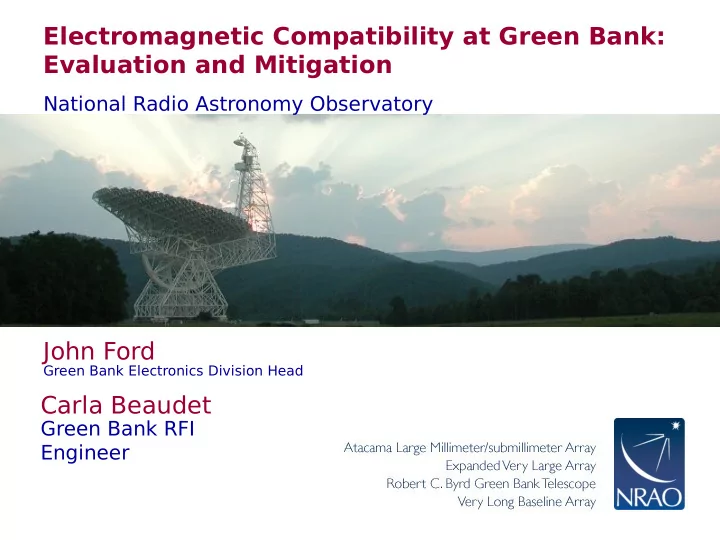
Electromagnetic Compatibility at Green Bank: Evaluation and Mitigation
National Radio Astronomy Observatory
Carla Beaudet
Green Bank RFI Engineer
John Ford
Green Bank Electronics Division Head
Electromagnetic Compatibility at Green Bank: Evaluation and - - PowerPoint PPT Presentation
Electromagnetic Compatibility at Green Bank: Evaluation and Mitigation National Radio Astronomy Observatory John Ford Green Bank Electronics Division Head Carla Beaudet Green Bank RFI Engineer Emissions Evaluation: Standards ITU-R
Green Bank Electronics Division Head
2
3
4
5
6 Equipment Under Test (EUT) Distance (Dtest) Receive (Rx) Antenna Cable #1 Amplifier Cable #2 Cable #3 Spectrum Analyzer
Spectrum Analyzer Setup and Measurement Results… Observed RFI Feature 1 2 3 4 Measured Frequency ( MHz ) 210.13 270.92 154.83 924.98 Corresponding Wavelength ( meters ) 1.43 1.11 1.94 0.32 Measured Peak Power ( dBm )
Spectrum Analyzer Resolution Bandwidth ( MHz ) 0.010 0.010 0.010 0.010 Measured Half-Power Bandwidth ( MHz ) 0.0100 0.0100 0.0100 0.0100 Signal Characteristics CW CW CW CW Measured Power Per Unit Resolution Bandwidth ( dBW/Hz )
Test Setup and Total Radiated Power Per Unit RBW Measured During Test… Test Antenna Number ( Select 1, 2, 3, or 4 from Equipment Table ) 2 2 2 2 Test Amplifier Number ( Select 1 through 7 from Equipment Table ) 3 3 3 3 Test Antenna Gain ( dBi ) 3.73 3.73 2.00 6.06 Equivalent Test Antenna Collecting Area ( m*m ) 0.38 0.23 0.47 0.03 Total Transmission Line Loss ( dB ) (modify if different cables used) 1.10 1.10 0.80 4.70 Preamplifier Gain ( dB ) 53.30 53.30 53.30 53.30 Distance From DUT to Test Antenna ( meters ) 7.00 7.00 7.00 7.00 Calculated Test Setup Space Loss ( dB ) 32.06 34.27 31.14 42.61 Total Radiated Power Per Unit RBW Measured During Test ( dBW/Hz )
Predicted Field Strength at Target Distance… Anticipated Distance to GBT ( meters ) 11 11 11 11 Calculated Field Strength at Target Distance ( dBW/m*m/Hz )
Predicted Impact on GBT Observations… Predictions for CONTINUUM OBSERVATIONS Corresponding Target GBT CONTINUUM Bandwidth ( MHz ) 3.00 3.00 1.00 20.00 Corresponding Target GBT CONTINUUM Limit ( dBW/m*m/Hz )
Calculated Field Strength Per Unit CONTINUUM Bandwidth ( dBW/m*m/Hz )
Calculated Field Strength Per Unit CONTINUUM Bandwidth ( Jy ) 8.46E+04 2.81E+04 1.08E+05 1.58E+05 Feature Exceeds Target CONTINUUM Limit By… ( dBW/m*m/Hz ) 33.77 28.98 31.32 38.78 Predictions for SPECTRAL LINE OBSERVATIONS Corresponding Target GBT SPECTRAL LINE Bandwidth ( MHz ) 2.00 2.00 1.00 8.00 Corresponding Target GBT SPECTRAL LINE Limit ( dBW/m*m/Hz )
7
8 Equipment Under Test (EUT) Distance (Dtest) Receive (Rx) Antenna Cable #1 Amplifier Cable #2 Cable #3 Spectrum Analyzer
Spectrum Analyzer Setup and Measurement Results… Observed RFI Feature 1 2 3 4 Measured Frequency ( MHz ) 210.13 270.92 154.83 924.98 Corresponding Wavelength ( meters ) 1.43 1.11 1.94 0.32 Measured Peak Power ( dBm )
Spectrum Analyzer Resolution Bandwidth ( MHz ) 0.010 0.010 0.010 0.010 Measured Half-Power Bandwidth ( MHz ) 0.0100 0.0100 0.0100 0.0100 Signal Characteristics CW CW CW CW Measured Power Per Unit Resolution Bandwidth ( dBW/Hz )
Test Setup and Total Radiated Power Per Unit RBW Measured During Test… Test Antenna Number ( Select 1, 2, 3, or 4 from Equipment Table ) 2 2 2 2 Test Amplifier Number ( Select 1 through 7 from Equipment Table ) 3 3 3 3 Test Antenna Gain ( dBi ) 3.73 3.73 2.00 6.06 Equivalent Test Antenna Collecting Area ( m*m ) 0.38 0.23 0.47 0.03 Total Transmission Line Loss ( dB ) (modify if different cables used) 1.10 1.10 0.80 4.70 Preamplifier Gain ( dB ) 53.30 53.30 53.30 53.30 Distance From DUT to Test Antenna ( meters ) 7.00 7.00 7.00 7.00 Calculated Test Setup Space Loss ( dB ) 32.06 34.27 31.14 42.61 Total Radiated Power Per Unit RBW Measured During Test ( dBW/Hz )
Predicted Field Strength at Target Distance… Anticipated Distance to GBT ( meters ) 11 11 11 11 Calculated Field Strength at Target Distance ( dBW/m*m/Hz )
Predicted Impact on GBT Observations… Predictions for CONTINUUM OBSERVATIONS Corresponding Target GBT CONTINUUM Bandwidth ( MHz ) 3.00 3.00 1.00 20.00 Corresponding Target GBT CONTINUUM Limit ( dBW/m*m/Hz )
Calculated Field Strength Per Unit CONTINUUM Bandwidth ( dBW/m*m/Hz )
Calculated Field Strength Per Unit CONTINUUM Bandwidth ( Jy ) 8.46E+04 2.81E+04 1.08E+05 1.58E+05 Feature Exceeds Target CONTINUUM Limit By… ( dBW/m*m/Hz ) 33.77 28.98 31.32 38.78 Predictions for SPECTRAL LINE OBSERVATIONS Corresponding Target GBT SPECTRAL LINE Bandwidth ( MHz ) 2.00 2.00 1.00 8.00 Corresponding Target GBT SPECTRAL LINE Limit ( dBW/m*m/Hz )
9
10
11
18