
Efficient Presentation of DICOM Mammography Images using Matlab
Mario Mustra, Mislav Grgic and Kresimir Delac
University in Zagreb, Faculty of Electrical Engineering and Computing Department of Wireless Communication
Unska 3/XII, HR-10000 Zagreb, Croatia Phone: + 385 1 6129 851, Fax: + 385 1 6129 568, E-mail: mario.mustra@fer.hr
Keywords: DICOM, Mammography, Histogram, Medical Imaging
Abstract – DICOM has become a standard for medical imaging. Its purpose is to standardize digital medical imaging and data for easy access and sharing. There are many commercial viewers that support DICOM image format and can read metadata, but image displaying is not always optimal. Since mammography images are mostly 12-bit grayscale images, image viewer has to be adapted for correct displaying when different number of bits has to be allocated. Another problem occurs when only a small portion of amplitudes is of interest to display. In this paper a method for efficient presentation of DICOM mammography images in Matlab is introduced. Algorithm that is developed does automatic contrast and brightness adjustments, regardless of bit dept of an image, number of amplitudes higher than zero and the number of allocated bits.
- 1. INTRODUCTION
As digital technologies are incorporated in every aspect
- f our lives, they are also the key part of medical
- diagnosis. DICOM (Digital Imaging and Communications
in Medicine) standard was developed to make sharing of medical information safe and above all standardized. Having a standard in digital medical imaging improves flexibility and speed in detection and getting a fast
- diagnose. DICOM version 3.0 is used today and has
become a standard in medical imaging and file exchange [1]. DICOM supports grayscale and color images of different formats. Besides image data, DICOM includes image-related data that are stored in the header of an image
- file. Some of the information included in the header is
image resolution, image type, number of stored bits, patient's name, etc. Software for viewing mammography images in most cases is provided by the manufacturer of medical imaging hardware. Other programs for image viewing have difficulties with correct displaying of images, mostly because the number of amplitudes that are different from zero is not the same as the bit depth of an
- image. Because of that they have to do automatic adjusting
- f the displayed amplitude range [2]. In this paper
histogram manipulation for a better DICOM image displaying in Matlab is described. The method described in this paper automatically calculates the amplitude range of a mammography image and uses Matlab's function which linearly stretches that range to achieve good image
- displaying. Sub-range image displaying which makes
presentation of mammography images more efficient, as another extension of this approach, has been added [5]. The paper is organized as follows: in Section 2 image representation and bit allocation in Matlab is explained. In Section 3 global and local histogram equalization is
- described. In Section 4 the method for efficient DICOM
mammography image displaying in Matlab is introduced and the results are shown. Section 5 draws the conclusion.
- 2. IMAGE REPRESENTATION IN MATLAB
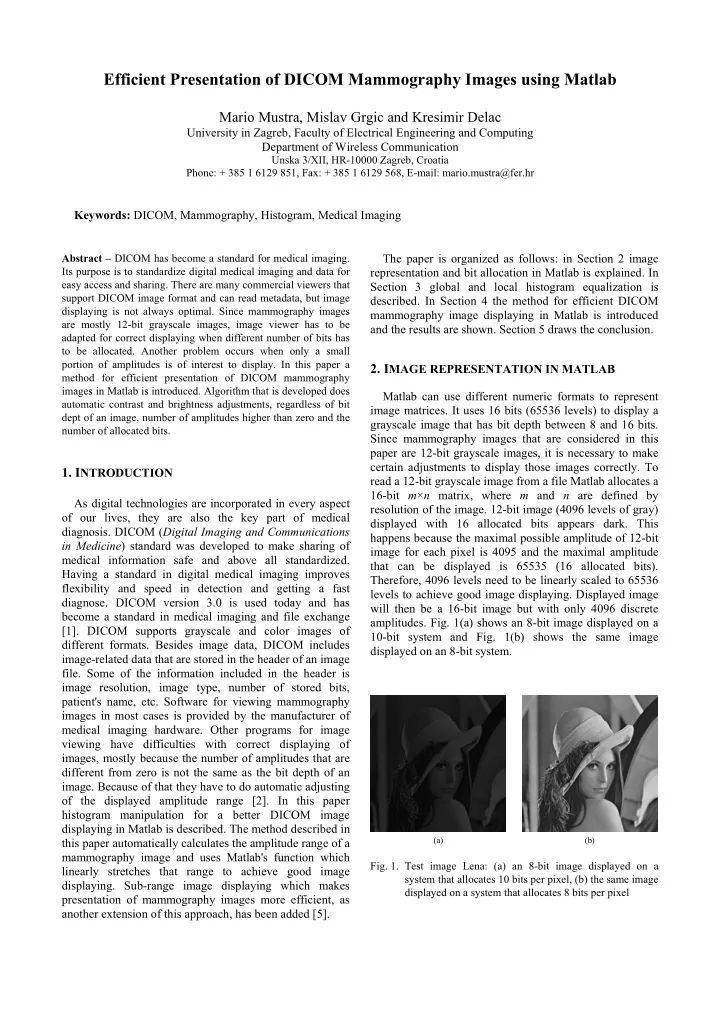
Matlab can use different numeric formats to represent image matrices. It uses 16 bits (65536 levels) to display a grayscale image that has bit depth between 8 and 16 bits. Since mammography images that are considered in this paper are 12-bit grayscale images, it is necessary to make certain adjustments to display those images correctly. To read a 12-bit grayscale image from a file Matlab allocates a 16-bit m×n matrix, where m and n are defined by resolution of the image. 12-bit image (4096 levels of gray) displayed with 16 allocated bits appears dark. This happens because the maximal possible amplitude of 12-bit image for each pixel is 4095 and the maximal amplitude that can be displayed is 65535 (16 allocated bits). Therefore, 4096 levels need to be linearly scaled to 65536 levels to achieve good image displaying. Displayed image will then be a 16-bit image but with only 4096 discrete
- amplitudes. Fig. 1(a) shows an 8-bit image displayed on a
10-bit system and Fig. 1(b) shows the same image displayed on an 8-bit system.
(a) (b)
- Fig. 1. Test image Lena: (a) an 8-bit image displayed on a
system that allocates 10 bits per pixel, (b) the same image displayed on a system that allocates 8 bits per pixel