
SLIDE 1
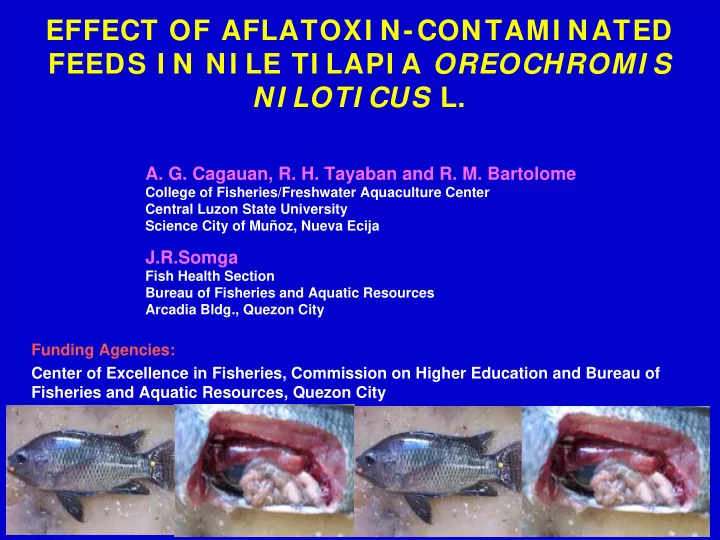
EFFECT OF AFLATOXI N-CONTAMI NATED FEEDS I N NI LE TI LAPI A OREOCHROMI S NI LOTI CUS L.
- A. G. Cagauan, R. H. Tayaban and R. M. Bartolome
College of Fisheries/Freshwater Aquaculture Center Central Luzon State University Science City of Muñoz, Nueva Ecija
J.R.Somga
Fish Health Section Bureau of Fisheries and Aquatic Resources Arcadia Bldg., Quezon City
Funding Agencies: Center of Excellence in Fisheries, Commission on Higher Education and Bureau of Fisheries and Aquatic Resources, Quezon City