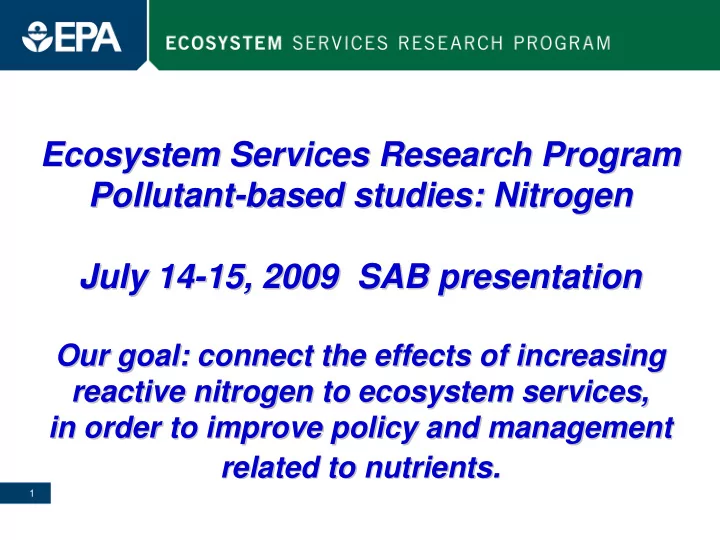
Ecosystem Services Research Program Ecosystem Services Research - - PowerPoint PPT Presentation

ecosystem services research program ecosystem services
SMART_READER_LITE
LIVE PREVIEW

Ecosystem Services Research Program Ecosystem Services Research - - PowerPoint PPT Presentation

Ecosystem Services Research Program Ecosystem Services Research Program Pollutant- -based studies: Nitrogen based studies: Nitrogen Pollutant July 14- -15, 2009 SAB presentation 15, 2009 SAB presentation July 14 Our goal: connect the


slide-1
SLIDE 1

1

Ecosystem Services Research Program Ecosystem Services Research Program Pollutant Pollutant-

  • based studies: Nitrogen

based studies: Nitrogen July 14 July 14-

  • 15, 2009 SAB presentation

15, 2009 SAB presentation

Our goal: Our goal: connect the effects of increasing connect the effects of increasing reactive nitrogen to ecosystem services, reactive nitrogen to ecosystem services, in order to improve policy and management in order to improve policy and management related to nutrients. related to nutrients.

slide-2
SLIDE 2

2

ESRP Organizational Matrix

Projects and Long term Goals → LTG 3 Pollutant- Specific Studies: 6% LTG 4 Ecosystem Specific Studies: 23% LTG 5: Community Based Demonstration Projects: For National, Regional, State and Local Decisions 28%

Theme Leads

Cross Program Themes and Research Objectives Nitrogen (6%) Wetlands (22%) Coral Reefs (5%) Willamette (11%) Tampa Bay (4%) Mid-West (4%) Coastal Carolinas (8%) Southwest (1%) Ecosystem Services and Human Well- Being (3%) Laura Jackson Valuation of Ecosystem Services Wayne Munns-- Consultation Committee Decision Support (6%) Ann Vega Integration, Well- Being, Valuation, Decision Support, Outreach and Education LTG 1 9% Outreach & Education to Open Landscape Characterization and Mapping (12%) Anne Neale Inventory and Monitoring of Services (14%)

Budgetary Information ~$71M ~272 In-house scientists and support staff

Mike McDonald Inventory, Map, and Forecast Ecosystem Services at multiple scales LTG 2 31% Modeling (5%) Tom Fontaine-- Consultation Committee Pollutant Specific Studies LTG 3 Nitrogen (6%) Jana Compton Eco-system Specific Studies LTG 4 Wetlands (22%) Janet Keough

Project Area Leads

Rick Linthurst and Iris Goodman Jana Compton Janet Keough Bill Fisher David Hammer Marc Russell Randy Bruins/ Betsy Smith Deborah Mangis Nita Tallent- Halsell Rick Linthurst and Iris Goodman Hal Walker: Place Based Coordinator

ESRP-N began as a row and has expanded to integrate across columns, particularly in LTG2.

slide-3
SLIDE 3

3

Nitrogen Writing Nitrogen Writing & Implementation Team & Implementation Team

Jana Compton Jana Compton NHEERL

NHEERL-

  • WED

WED

Robin Dennis Robin Dennis NERL

NERL-

  • RTP

RTP

Hal Walker Hal Walker NHEERL

NHEERL-

  • AED

AED

Steve Jordan Steve Jordan NHEERL

NHEERL-

  • GED

GED

Brian Hill Brian Hill NHEERL

NHEERL-

  • MED

MED

Ken Fritz Ken Fritz NERL

NERL-

  • Cinci

Cinci

Richard Devereux Richard Devereux NHEERL

NHEERL-

  • GED

GED

Bryan Milstead Bryan Milstead NHEERL

NHEERL-

  • AED

AED

Jake Beaulieu Jake Beaulieu NRMRL

NRMRL-

  • Cinci

Cinci

Expert hire Expert hire: John Harrison : John Harrison Washington State University, Washington State University, Vancouver, Washington Vancouver, Washington

Jim Latimer Jim Latimer NHEERL

NHEERL-

  • AED

AED

Jason Lynch Jason Lynch OAR

OAR-

  • CAMD

CAMD

Anne Rea Anne Rea OAR

OAR-

  • OAQPS

OAQPS

Randy Waite Randy Waite OAR

OAR-

  • OAQPS

OAQPS

Christine Davis Christine Davis OAR

OAR-

  • OAQPS

OAQPS

Edward Dettmann Edward Dettmann NHEERL

NHEERL-

  • AED

AED

Tara Greaver Tara Greaver NCEA

NCEA

Annie Neale Annie Neale NERL RTP

NERL RTP

Holly Campbell Holly Campbell NHEERL

NHEERL-

  • WED

WED

NRC post NRC post-

  • doc

doc NHEERL

NHEERL-

  • WED

WED

slide-4
SLIDE 4

4

Outline of presentation

  • Background

Background

  • Research directions and early results

Research directions and early results

  • Much new since 2008 SAB review
  • Implementation plan external review May

2009; Final version now in management approvals

  • National, Regional and Place-based work
  • Science needs and the end goals

Science needs and the end goals

slide-5
SLIDE 5

5

Why Nitrogen and Ecosystem Services?

  • Nitrogen is a

Nitrogen is a critical critical component of component of energy, food, energy, food, and fiber and fiber production, production, benefiting benefiting humans in humans in many ways. many ways.

from Galloway et al. (2003)

Energy production NO x People (food; fiber) Food production

slide-6
SLIDE 6

6

Why Nitrogen and Ecosystem Services?

  • However, N

However, N is a major is a major stressor for stressor for many many ecosystems. ecosystems.

Energy production NO x People (food; fiber) Ozone effects NH x Norganic Groundwater effects Particulate Matter effects Stratospheric effects N 2O

Air

Food production Surface water effects Ocean effects NH 3 NO 3 Soil Plant Agroecosystem effects Soil Crop Animal Forests & Grasslands effects Coastal effects NH x NO y NO x Greenhouse effects N2O N2O (terrestrial) NH x NO y N2O (aquatic)

from Galloway et al. (2003) Land Water

slide-7
SLIDE 7

7

Why N and Ecosystem Services for EPA?

  • Air quality regulations

Air quality regulations

  • Currently National Ambient Air Quality Standards review

process underway for secondary NOxSOx standard (current standards set in 1971)

  • Ecosystem service impacts included in risk assessment
  • Water quality regulations

Water quality regulations

  • Nitrogen in top 3 of stressors causing stream impairment
  • Nutrient criteria needed for many streams
  • Seasonal hypoxia, algal blooms, fisheries impact in many areas
  • EPA

EPA’ ’s SAB Integrated Nitrogen Committee s SAB Integrated Nitrogen Committee

  • Draft report calls for greater intra- and interagency cooperation
  • Ecosystem services viewed as one tool to improve management
slide-8
SLIDE 8

8

Key question for ESRP-Nitrogen: How do we use nitrogen most efficiently to balance human needs with impacts on water, air and aquatic life?

N input to the landscape

  • Relative value +

Fisheries Crop production Carbon storage Water quality

Hypothetical effect of N load on services

slide-9
SLIDE 9

9

Human Behavior

Individual Actions Regulations & Incentives Markets, Technology Policy & Land Management

Human Outcomes

Quality of Life Human Health Economic Condition Values

Biophysical Context Community Structure

Species Composition Biomass & Turnover Trophic Complexity Landscape Pattern

Ecosystem Function

1° and 2˚ Productivity Biogeochemical Cycles Erosion & Sedimentation Eutrophication N / P Interactions

Disturbance Regimes Presses

Nutrient Loading Air, Water, & Soil Quality Ozone Exposure Warming & Sea Level Rise

Pulses

Runoff & Discharge Hydrologic Alterations Disease & Pest Outbreaks Drought, Fire, Storm, Flood,

Ecosystem Services External Drivers

Climate, Nr, Land Use/Cover

Q6 Q1 Q4 Q5 Q2 Q3 Population Growth

Globalization Greenhouse Gas Fine Particulates

Adapted from U.S. Long Term Ecological Research, Decadal Plan (LTER 2007)

Provisioning

Food, Fiber, & Fuel Clean Water & Air

Regulating

Climate Regulation

Supporting

Denitrification Habitat / Refugia

Cultural

Sense of Place Recreation, Aesthetics

Social Context

ESRP-N Conceptual Framework

slide-10
SLIDE 10

10

Available relationships

  • f sensitive ecosystems

(e.g. Critical Loads, Indicators, TMDLs)

Develop ESRFs (effects of drivers

  • n ES)

Create maps of At risk Ecosystems Identify and bundle Services

2 5 10 20 50 100 200

Relative value

Biodiversity (algae, lichens, alpine grasses) Far m pr
  • duction
Wood pr
  • duction*
Aquati c Producti
  • n/eutr
  • phicati
  • n
Water quality

Develop Ecological Response Functions Response of ES bundles to mgmt/policy change

System-based Studies Place-based Studies

Freshwater

Wetlands

Terrestrial Coastal

Corals Place-based Studies

(plus NCEA assessment and OAR and Interagency work on Critical Loads)

Modeling Decision Support

Maps of N loads

Monitoring Mapping

ESRP-N “Road Map”

Decision Support

Colored boxes identify work with other ESRP themes

slide-11
SLIDE 11

11

ESRP-N Research Themes

  • National Scale Themes

National Scale Themes

  • Theme 1: Nutrient Loading (sources, flux and fate)
  • Theme 2: Identification of Services
  • Regional Scale Themes

Regional Scale Themes

  • Theme 3: Nutrient Cycling and Ecosystem Services
  • Theme 4: Tipping Points in Ecosystem Condition

and Services Will include phosphorus where possible. We hope this work will inform management of other nutrients.

slide-12
SLIDE 12

12

Theme 1 – N sources and removal

  • N sources at National Scale

N sources at National Scale

  • Deposition - CMAQ
  • Confined Animal Feedlots - Mapping
  • Fertilizers – with Mapping
  • Sewage Treatment Plants - Mapping
  • Modeling tools to estimate N removal

Modeling tools to estimate N removal

  • SPARROW (workshop fall 2009)
  • Global NEWS (with expert John Harrison)
  • Estuarine fate modeling (AED)
slide-13
SLIDE 13

13

Human activities accelerated transfer of N from the atmosphere to biosphere

Galloway et al. 2004 Biogeochemistry

Nitrogen fixed from atmosphere

North America early 1990s 25 Tg N yr-1

Lightning Fossil Fuel combustion Agricultural

  • Biol. N2

fixation Fertilizers Non-Agricultural

  • Biol. N2

fixation

Fate of fixed N

Outputs ~40%

Rivers, Advection, Commodities

Storage ~15%

Plants, Soils, Groundwater

Denitrified to N2 ~45%

By difference

* * * *

*Greatest Uncertainties

slide-14
SLIDE 14

14

FML and Mapping group

  • Better land use

information and spatial resolution better N accounting

  • Partition fertilizer

application by crop type

  • National coverage 2011

Land use and N inputs

slide-15
SLIDE 15

15

Modeling and ESRP-N

  • National run of NEWS

National run of NEWS-

  • DIN

DIN

  • Regional run of NEWS

Regional run of NEWS-

  • DIN for Mississippi

DIN for Mississippi Basin Basin

  • Approaches for estimating N removal by river

Approaches for estimating N removal by river networks, and lakes/reservoirs networks, and lakes/reservoirs

  • Comparisons of SPARROW, NEWS, AGNPS

Comparisons of SPARROW, NEWS, AGNPS (& others) for (& others) for “ “weight of evidence weight of evidence” ” approach approach to N removal and futures projections to N removal and futures projections -

  • similar

similar to IPCC to IPCC

slide-16
SLIDE 16

16

NEWS-DIN Model Structure

Naturally Fixed N Naturally Fixed N + + Non Non-

  • point

point-

  • source N

source N

(Fertilizer, Manure, Legumes, Atmos. N Dep.) (Fertilizer, Manure, Legumes, Atmos. N Dep.)

Point Point-

  • source N

source N (Urban Sewage) (Urban Sewage) Sewage Sewage Treatment Treatment Crop N removal Crop N removal

River and Reservoir N River and Reservoir N Retention Retention + + Consumptive Water Use Consumptive Water Use (Primarily Irrigation) (Primarily Irrigation)

N Sources N Sources N Sinks N Sinks Hydrology Hydrology Hydrology Hydrology DIN Yield DIN Yield (kg N km (kg N km-

  • 2

2

yr yr-

  • 1

1)

)

John Harrison, WSU

slide-17
SLIDE 17

17

Scenario DIN yields (kg N/km2/yr)

2030 scenarios vs. mean 2030 rate Different actions = very different outcomes

80

  • 10

10 40 < -250

  • 80
  • 40

kg N/km2/yr

> 250

Run 4, 5/22/08

N yield change

Order from Strength Adapting Mosaic Global Orchestration Techno-garden

John Harrison, WSU

slide-18
SLIDE 18

18

N removal: Ecosystem service

N removal efficiency (% of flux)

Brian Hill and Dave Bolgrien, in review

Stream depth, m

0.1 1 10 20 40 60 80 100

b)

  • uses stream survey data
  • scales with stream depth
  • estimate for network
  • value of stream N removal
slide-19
SLIDE 19

19

Theme 2: Identification of Services and Theme 2: Identification of Services and Relationship to Nitrogen inputs Relationship to Nitrogen inputs

Human health Farm, Fish & Forest Harvest STRUCTURE

Species distribution and abundance, Food Webs, Spatial Organization

Environmental Drivers Presses and Pulses of Disturbance

Δ Δ Drivers & Drivers & Disturbance Disturbance Δ Δ Ecosystem Ecosystem Properties Properties Δ Δ Ecosystem Ecosystem Services Services Δ Δ Human Human Benefits Benefits Adaptive Management

FUNCTION

Nutrient Cycling, Soil Formation, Competition, Reproduction, Mortality

Δ Δ Human Human Actions Actions

Drinking Water Provision Aesthetics Biogeochemical cycling Water Quality Fisheries Production Aquatic Habitat Biodiversity Air Quality Farm & Forest Production Climate (GHG) Regulation Management Individual Decisions Markets Regulations Technology Nutrient loading Ozone exposure Water Use Acid deposition Climate Soils Land use Recreation Swimming and Recreation

slide-20
SLIDE 20

20

State of Science paper 2010 –sources

  • ESRP

ESRP-

  • N literature survey

N literature survey

  • 1900+ references; with Holly Campbell (JD, LLM, MS)
  • National Ambient Air Quality Standards process

National Ambient Air Quality Standards process

  • Integrated Science Assessment (ISA) for Oxides of Nitrogen

and Sulfur – Ecological Criteria (Final Report 12/08)

  • Risk and Policy Assessments underway
  • These include impacts on Ecosystem Services
  • EPA

EPA’ ’s Science Advisory Board s Science Advisory Board

  • Integrated Nitrogen Committee (final report Fall 2009)
  • Gulf of Mexico Hypoxia 2007 report
  • Multiple recent special issues on denitrification

Multiple recent special issues on denitrification

slide-21
SLIDE 21

21

Integrated Science Assessment (ISA) for Oxides of Nitrogen and Sulfur - Ecological Criteria EPA 2008

slide-22
SLIDE 22

22

EPA-Office of Water National Stream Survey

  • Nitrogen is key stressor for stream impairment

EPA Wadeable Streams Assessment (2006)

slide-23
SLIDE 23

23

EPA Wadeable Streams Assessment (2006)

slide-24
SLIDE 24

24

Wetland N service hierarchy

Steve Jordan, NHEERL-GED

slide-25
SLIDE 25

25

Gulf of Mexico Coastal Wetlands

N removal efficiency

20 40 60 80 100 120 20 40 60 80 100

N Load (g N/m

2/y)

N removal efficiency (% )

Forested FW marsh

  • Higher N load

Higher N load – – less % N less % N removed removed

  • Values from

Values from literature, mostly literature, mostly LA & WWT LA & WWT

  • Need values for

Need values for salt marsh, salt marsh, mangroves, rest mangroves, rest

  • f GOM
  • f GOM

Virginia Engle EPA-NHEERL-GED et al.

slide-26
SLIDE 26

26

Chlorophyll a – TN relationships for Four Estuarine Embayments

y = 71.1x2.25 R2 = 0.97 y = 106x2.29 R2 = 0.92 y = 55.1x2.41 R2 = 0.98 y = 21.4x2.15 R2 = 0.88 1 10 100 0.10 1.00 10.00

[TN] (mg L-1) [Chl a ] (μg L-1)

LIS BH-MB PEC TMP

LIS: BH-MB: PEC: TMP:

BH-MB = Boston Harbor-Mass. Bay LIS = Long Island Sound, PEC = Peconic Estuary TMP = Tampa Bay

The vertical displacements of these four systems are quantitatively explained by water clarity. Edward Dettmann et al. (EPA-NHEERL-AED)

slide-27
SLIDE 27

27

The EPA Atlantic Ecology Division Northeast Lakes Concept Map

Hal Walker, Bryan Milstead NHEERL-AED

slide-28
SLIDE 28

28

Northeastern Lakes Evaluation of Management Alternatives

How will local or regional management choices affect the delivery of ecosystem service benefits to stakeholders? What tradeoff and conflicts will occur among users? Who will benefit from management choices and who will pay the cost of unintended consequences and lost opportunities?

Swimming Fishing Boating Property Values Drinking Water Irrigation Water Hydropower Waste Assimilation Species Recovery Plans Water Treatment

P l a n A P l a n B P l a n C A Unit of Currency

  • 150
  • 100
  • 50

50 100

Costs Benefits

Hal Walker, Bryan Milstead NHEERL-AED

slide-29
SLIDE 29

29

7/10/2009

Place-based studies are being used to compare methods for a variety of environmental settings, scales, & stakeholder issues, and to look at future scenarios.

Southwest

Nitrogen studies

Future Midwestern Landscapes

ESRP Place Based

NE Freshwater Eastern Coastal

slide-30
SLIDE 30

30

Research Questions Research Questions Theme 1: Theme 1: Nutrient Nutrient loading loading Theme 2: Theme 2: Service Service Measures Measures Theme 3: Theme 3: Nutrient Nutrient cycling cycling Theme 4: Theme 4: Tipping Tipping Points Points Place Place-

  • Based

Based FML FML Place Place-

  • Based

Based Tampa Tampa System System-

  • Based

Based Wetlands Wetlands

  • R1. N delivery and removal
  • R1. N delivery and removal
  • R2. N impacts on structure
  • R2. N impacts on structure

and function (ERF and function (ERF development) development)

  • R3. N impacts on multiple
  • R3. N impacts on multiple

services (ESRF services (ESRF development) development)

  • R4. Identification of key
  • R4. Identification of key

services impacted by N services impacted by N

  • R5. Human health and well
  • R5. Human health and well-
  • being impacts

being impacts

  • R6. Human benefits &
  • R6. Human benefits &

decisions impacted by N decisions impacted by N

  • R7. Tradeoffs between N
  • R7. Tradeoffs between N

and services and services

  • R8. Technology and
  • R8. Technology and

restoration impacts on N restoration impacts on N

  • R9. Effectiveness of
  • R9. Effectiveness of

management and policy management and policy

  • ptions to reduce N
  • ptions to reduce N
  • R10. Human decisions and
  • R10. Human decisions and

N delivery N delivery

slide-31
SLIDE 31

31

Challenges for ESRP-N

  • Nutrients are a substantial and persistent problem

Nutrients are a substantial and persistent problem

  • N removal may decrease with N load
  • Population growth and water treatment (3°)
  • Climate change interactions
  • Strategic approach.

Strategic approach. Nitrogen comes from many sources, has many Nitrogen comes from many sources, has many processes, many fates, many systems impacted. Deciding where to processes, many fates, many systems impacted. Deciding where to focus our limited energy while not neglecting the whole is key. focus our limited energy while not neglecting the whole is key.

  • Media - Land, air, water.
  • Sources - Power plants, mobile sources, fertilizers, etc.
  • Scale - Produce tools and information that can/will be used.
  • Spatial and temporal variability - Timing of inputs vs. impacts.
  • Regulatory and Management options - sewage treatment,

wetland restoration, emission reductions, reducing fertilizer applications, better feedlot management, BMPs, etc.

  • Ecosystem services is new territory.

Ecosystem services is new territory. No reviews or models exist No reviews or models exist to link N and ecosystem services to link N and ecosystem services – – we must create these. we must create these.

  • Models.
  • Models. How do we best use models to address our questions?

How do we best use models to address our questions? Which models? Which models?

slide-32
SLIDE 32

32

The end result of this work will be the development

  • f credible, scientifically-based methods to:
  • Inventory, measure and map ecosystem services

Inventory, measure and map ecosystem services related to reactive nitrogen at multiple scales; related to reactive nitrogen at multiple scales;

  • Connect the effects of reactive nitrogen to ecosystem

Connect the effects of reactive nitrogen to ecosystem services; services;

  • Provide regulatory community with sound data and

Provide regulatory community with sound data and tools that represent the appropriate uncertainties in tools that represent the appropriate uncertainties in

  • rder to understand N impacts on ecological and
  • rder to understand N impacts on ecological and

human systems, so decisions can be made. human systems, so decisions can be made.

slide-33
SLIDE 33

33

Jana Compton, ESRP-N lead compton.jana@epa.gov

Thank you

slide-34
SLIDE 34

34

Timeline for ESRP-N

FY09 FY12 FY10 FY11

Implementation Plan – April 2009 Review paper on ES and reactive N – draft fall 2009 National NEWS model – 2010 Regional NEWS (MidWest) – 2011 Sensitive ecosystems and critical loads – 2011 Report on the value of ecological services provided by and affected by Nr - 2012 Theme 1 Theme 2 Theme 2 Theme 3 Theme 4 Ecosystem services and nutrient cycling – site-specific studies

slide-35
SLIDE 35

35

Economic N cascade

Moomaw and Birch 2005 Science in China