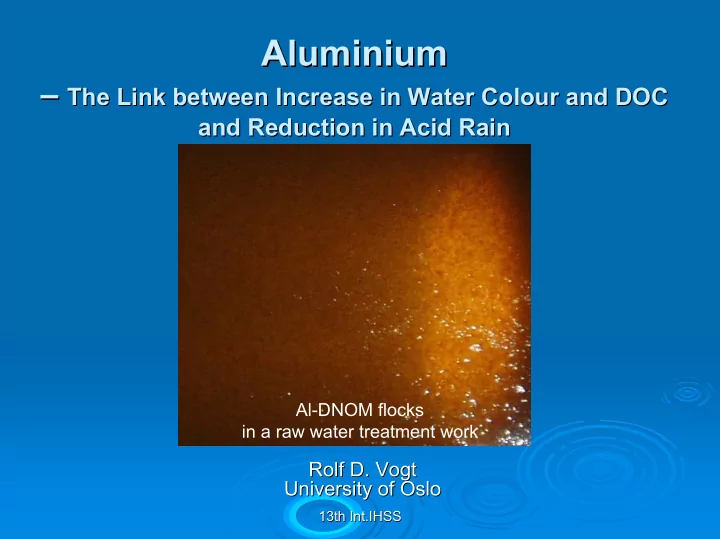
aluminium aluminium
play

Aluminium Aluminium The Link between Increase in Water Colour and - PowerPoint PPT Presentation

Aluminium Aluminium The Link between Increase in Water Colour and DOC The Link between Increase in Water Colour and DOC and Reduction in Acid Rain and Reduction in Acid Rain Al-DNOM flocks in a raw water treatment work Rolf D. Vogt


  1. Aluminium Aluminium – The Link between Increase in Water Colour and DOC – The Link between Increase in Water Colour and DOC and Reduction in Acid Rain and Reduction in Acid Rain Al-DNOM flocks in a raw water treatment work Rolf D. Vogt Rolf D. Vogt University of Oslo University of Oslo 13th Int.IHSS Int.IHSS 13th

  2. Increasing Dissolved Natural Organic Increasing Dissolved Natural Organic Matter (DNOM) in surface waters Matter (DNOM) in surface waters in Northern Europe and North- -Eastern America Eastern America in Northern Europe and North ICP Waters, Skjelkvåle, 2003 “Large increases in dissolved carbon concentration across the UK may be a combined response to climate change and decreasing acid deposition” Evans et al., 2005 Regional trend results for ICP Waters sites for the period 1990-2001 13th Int. IHSS 13th Int. IHSS

  3. Increased color Increased color in surface waters in SE Norway in surface waters in SE Norway Eikebrokk et al., 2004 � Color increase in Oslo’s raw waters: Maximum color levels from monthly samples � A doubling or almost tripling of color in some sources from 1990-2002 13th Int. IHSS 13th Int. IHSS

  4. Increased DOC Increased DOC in surface waters in UK in surface waters in UK UK Acid Waters Monitoring Network , Evans et al., 2006 � DOC concentration increases in streams and lakes : 4 4 Lakes Streams standardised concentration standardised concentration 2 2 0 0 -2 -2 Jul-88 Jul-89 Jul-90 Jul-91 Jul-92 Jul-93 Jul-94 Jul-95 Jul-96 Jul-97 Jul-98 Jul-99 Jul-00 Jul-01 Jul-02 Jul-88 Jul-89 Jul-90 Jul-91 Jul-92 Jul-93 Jul-94 Jul-95 Jul-96 Jul-97 Jul-98 Jul-99 Jul-00 Jul-01 Jul-02 Concentration standardized plots � Since 1988, there has been, on average, a 91% increase in DOC concentrations of UK lakes and streams 13th Int. IHSS 13th Int. IHSS

  5. Color is changing more than DOC Color is changing more than DOC Hongve et al., 2004 � The change that took place by the end of 2000 was > 40% for color and only 11–13% for DOC � This implies changes in the composition of DNOM � Higher M w , more hydrophobic and more humic 13th Int. IHSS 13th Int. IHSS

  6. Considered Considered Key variable factors Key variable factors NOM NOM Considered Key variable factors DNOM shift shift Conc. Conc. shift Conc. Possible causes Possible causes Climate variation Climate variation Climate variation + + + + Precipitation amount Precipitation amount + Precipitation amount + for changes in for changes in + + Precipitation intensity Precipitation intensity +/- +/- + Precipitation intensity +/- - - Snow relative to rain Snow relative to rain + + - Snow relative to rain + DNOM amount DNOM amount - - Spring flood Spring flood +/- +/- - Spring flood +/- + + Hydrologic connectivity Hydrologic connectivity + + + Hydrologic connectivity + and quality and quality + + Soil moisture Soil moisture + + + Soil moisture + - - Water retention time Water retention time + + - Water retention time + + + Fall and winter temperature Fall and winter temperature + + + Fall and winter temperature + NORDTEST Workshop, Vogt 2003 + + Radiation Radiation ? ? + Radiation ? Land use changes Land use changes � Three main causes: + + Forestation Forestation + + +/- +/- Species Species +/- +/- 1. Climate variation + + Biomass Biomass + + +/- +/- Drainage Drainage +/- +/- 2. Land use changes +/- +/- Site preparation Site preparation +/- +/- 3. Changes in Changes in Atmospheric deposition - Reduced acid rain + Anthropogenic + Accumulated N + deposition + Sea-salts ? 13th Int. IHSS 13th Int. IHSS

  7. 1. Climate variation 1. Climate variation The Intergovernmental Panel on Climate Change, IPCC 2001 � Increased temperature and precipitation Increased temperature and precipitation � � Northern hemisphere over the 20th century Northern hemisphere over the 20th century � • 1990s being the warmest decade of the 1990s being the warmest decade of the • millennium. . millennium • Precipitation increased by 5 Precipitation increased by 5- -10% 10% • � Likely also an increase in heavy precipitation events Likely also an increase in heavy precipitation events � 13th Int. IHSS 13th Int. IHSS

  8. Relation between Relation between precipitation intensity precipitation intensity and DNOM and DNOM Variation in color and � DOC is well correlated to runoff DNOM in the forest � floor is larger and more colored than in the mineral soil Climate can not � alone explain the 0,700 unprecedented Birkenes Fall high DOC Spring catchment 0,600 concentration and Summer color in 2001 0,500 UV absorbency Evans et al. (2006) � 0,400 argue that “climatic factors 0,300 may not be the dominant drivers 0,200 of DOC change”. 0,100 Waterworks, Oslo, data from Hongve et al., 2004 1 10 100 1000 13th Int. IHSS 13th Int. IHSS Discharge L sek -1

  9. 2. Land- -use change use change 2. Land � There has been an There has been an � increase in the terrestrial increase in the terrestrial organic mass over the organic mass over the past two decades past two decades � This is evident as a This is evident as a � significant carbon sink significant carbon sink Nature; Schimel et al., 2001 � High DNOM flux from watersheds with: � Large soil pools of humus relative to mineral soil NIJOS � Forestation increase DNOM leaching 13th Int. IHSS 13th Int. IHSS

  10. 3. Decrease in 3. Decrease in Acid Rain Acid Rain Wright, R.F., et al. 2005; SFT, 2005; a.o. � By 2000, By 2000, � relative to mid- -1980s, 1980s, relative to mid sulfur deposition had sulfur deposition had decreased regionally decreased regionally � by >50% in Europe by >50% in Europe � � by ~40% in North America by ~40% in North America � � Sulfate concentrations in Sulfate concentrations in � surface waters dropped surface waters dropped by between 30 – – 70%. 70%. by between 30 13th Int. IHSS 13th Int. IHSS

  11. Empirical relation Empirical relation between between acid rain and DNOM acid rain and DNOM Exceedence of acid in � The same regions meq/m2/yr experiencing a decrease in H 2 SO 4 are Skjelkvåle et al., 2001 experiencing an increased DNOM In the 70 and 80ties reduction � in the color in lakes were reported in the regions suffering acid rain (Dixit et al., 2001) Evans et al., 2006 13th Int. IHSS 13th Int. IHSS

Download Presentation
Download Policy: The content available on the website is offered to you 'AS IS' for your personal information and use only. It cannot be commercialized, licensed, or distributed on other websites without prior consent from the author. To download a presentation, simply click this link. If you encounter any difficulties during the download process, it's possible that the publisher has removed the file from their server.

Recommend


More recommend