
SLIDE 1
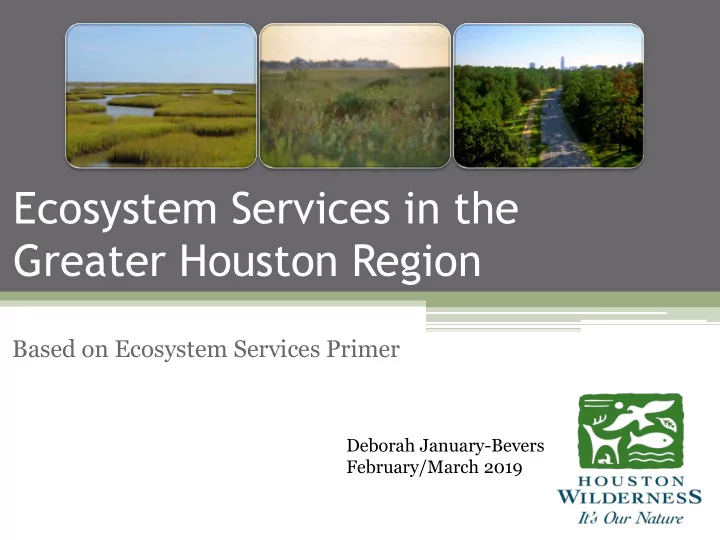
Ecosystem Services in the Greater Houston Region
Based on Ecosystem Services Primer
Deborah January-Bevers February/March 2019
Ecosystem Services in the Greater Houston Region Based on Ecosystem - - PowerPoint PPT Presentation
Ecosystem Services in the Greater Houston Region Based on Ecosystem Services Primer Deborah January-Bevers February/March 2019 Houston is an Ecologically Diverse Region Ecoregions: Big Thicket Piney Woods Trinity Bottomlands
Deborah January-Bevers February/March 2019
Ecoregions:
Wetlands and Estuaries
estuaries
improved
Prairies
system costs
Forests
property values
use/costs
Soil Content of the 8-County Gulf-Houston Region
10.1%[i]
2.7%
1.0 %
12.0%
18.0%
9.1%
1.2%
15.3%
7.0%
7.5%
8.1%
4.0%
[https://globalrangelands.org/topics/rangeland-ecology/twelve-soil-orders
Slide adapted from GalvCorps, 2014 Coastal Protection & Restoration Project.
9.2% of the Total Undeveloped Land is Nature-Based Infrastructure
County Total Land Cover (acres) Total Develope d Land %
Land Currently Protected % (w/ acres)
Available Undeveloped Land%
Harris 1,095,040 51% 2.5% (122,064) 46.5% Montgomery 663,616 32% 1.3% (62,081) 66.7% Fort Bend 554,624 25% 0.4% (19,065) 74.6% Liberty 740,096 13% 0.7% (36,004) 86.3% Waller 326,336 12% 0.2% (9,305) 87.8% Galveston 235,008 10% 0.5% (22,796) 89.5% Brazoria 878,080 10% 2.7% (135,043) 87.3% Chambers 378,496 8% 1.3% (62,498) 90.7% Total 4,871,296 26% 9.6% 64.4%
Maintaining & Enhancing protected/preserved lands – 477,879 Adding 15% in protected/preserved lands – 730,694 Adding non-protected areas on corporate and residential lands – 550,456 Percentage 4% 11.3% 9.7% 15% 10% 50% Adding 10% non-protected areas on agricultural lands – 487,129 TOTAL
Nature-Based Stabilization = Use of native plants and trees in Low-Impact Development (LIDs), public private drainage and detention areas, riparian corridors and waterways, levees and reservoirs, reforestation and afforestation, coastal breakwaters and living shorelines, oyster reefs
Infrastructure need: Water Quality, Water Supply, Water Detention/Retention and Flood Control Solution(s):
wetland and prairie grasses
park
for water retention in heavy rain events
$3.2 Million
http://www.projectbrays.org/about.html
▫ Food and fiber ▫ Timber and minerals ▫ Fuels ▫ Medicinal resources
▫ Recreation ▫ Spiritual and historic ▫ Science and education
▫ Climate regulation ▫ Waste treatment ▫ Water regulation ▫ Nutrient regulation
▫ Primary production ▫ Nutrient cycling ▫ Water cycling
From Jim Lester
On-site Ecological Function Analysis Benefit Transfer Literature Review Avoided Cost Replacement Cost Mitigation/Restoration Cost Direct Market Price Hedonic Pricing Function Monitoring Spatial Impact on Function Outright Losses Substitute Equivalency Building Something New Energy Savings Insurance Savings Property Value
Cost of Illness
25
1
26
2
27
3
28
4
29
5
30
6