e mail somchaib tmd go th somchaibm 97 metnet tmd go th
play

E-mail: somchaib@tmd.go.th , somchaibm_97@metnet.tmd.go.th KEY WORDS: - PDF document

PALMER METEOROLOGICAL DROUGHT CLASSIFICATION USING TECHNIQUES OF GEOGRAPHIC INFORMATION SYSTEM IN THAILAND S. Baimoung, W. Waranuchit, S. Prakanrat, P. Amatayakul, N. Sukhanthamat, A. Yuthaphan, A. Pyomjamsri, M, Panprom, and R. Buapean Thailand


  1. PALMER METEOROLOGICAL DROUGHT CLASSIFICATION USING TECHNIQUES OF GEOGRAPHIC INFORMATION SYSTEM IN THAILAND S. Baimoung, W. Waranuchit, S. Prakanrat, P. Amatayakul, N. Sukhanthamat, A. Yuthaphan, A. Pyomjamsri, M, Panprom, and R. Buapean Thailand Meteorological Department 4353 Sukhumvit Rd., Phrakanong, Bang Na, Bangkok 10260, THAILAND Tel:(66) 2393-1682, Fax:(66) 2399-2322 E-mail: somchaib@tmd.go.th , somchaibm_97@metnet.tmd.go.th KEY WORDS: Palmer Meteorological Drought Index, SWAP, Kriging spatial analysis and Digital Map. Introduction Due to the problems on implementation of water resources management for usage and consumption in Thailand, like as more excess water to flooding in rainy season and followed by water shortage in dry season continuously within a short period of time. Some areas are scare of rainfall throughout 5-6 months that is lead to lacking of soil water content and affected on agricultural plantation areas and so on. To over come these problems, the methodology of quantitative drought classification in term of figures or indices is necessary to be commonly used. Nevertheless, unfortunately, up to this moment no more those indices have been accepted at national or international level absolutely. Thus, in this study, be just focusing on the Palmer Meteorological Drought 
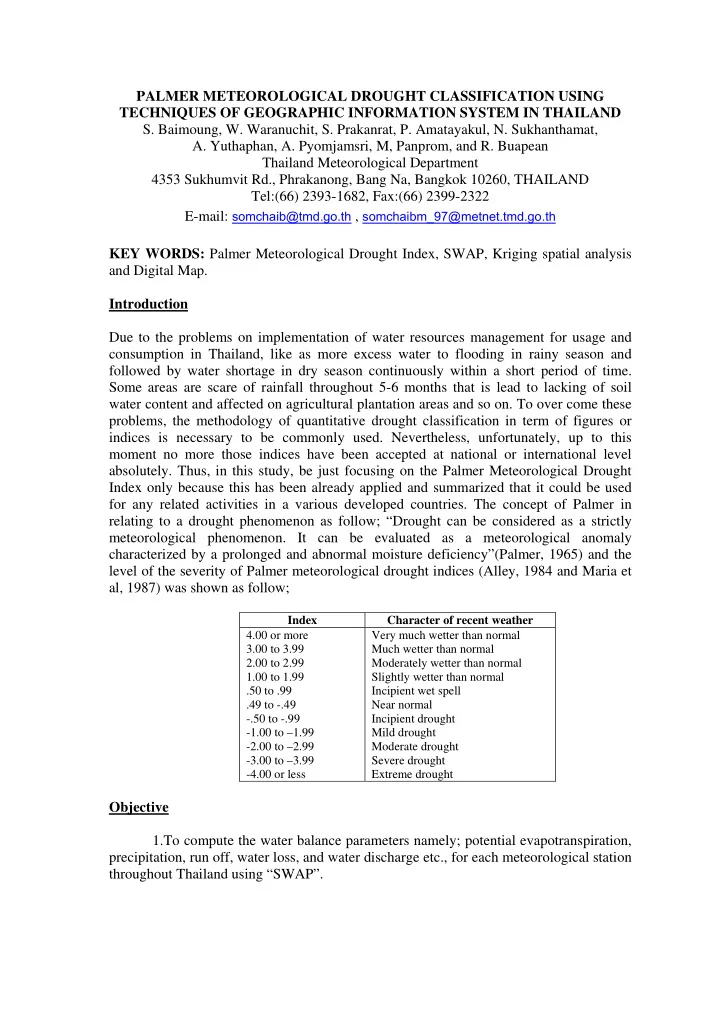
Index only because this has been already applied and summarized that it could be used for any related activities in a various developed countries. The concept of Palmer in relating to a drought phenomenon as follow; “Drought can be considered as a strictly meteorological phenomenon. It can be evaluated as a meteorological anomaly characterized by a prolonged and abnormal moisture deficiency”(Palmer, 1965) and the level of the severity of Palmer meteorological drought indices (Alley, 1984 and Maria et al, 1987) was shown as follow; Index Character of recent weather 4.00 or more Very much wetter than normal 3.00 to 3.99 Much wetter than normal 2.00 to 2.99 Moderately wetter than normal 1.00 to 1.99 Slightly wetter than normal .50 to .99 Incipient wet spell .49 to -.49 Near normal -.50 to -.99 Incipient drought -1.00 to –1.99 Mild drought -2.00 to –2.99 Moderate drought -3.00 to –3.99 Severe drought -4.00 or less Extreme drought Objective 1.To compute the water balance parameters namely; potential evapotranspiration, precipitation, run off, water loss, and water discharge etc., for each meteorological station throughout Thailand using “SWAP”.

  2. 2. To compute the severity of Palmer meteorological drought indices in each meteorological station throughout Thailand in various levels from –4.00 or less (Extreme drought) to 4.00 or more (Very much wetter than normal) using Palmer’s classification. 3. To interpolate and extend the severity of Palmer meteorological drought indices from 2 to other areas without meteorological station using GIS spatial analysis “Kriging techniques” in form of grid cell digital maps of Thailand in scale 1:250,000 showing the severity of Palmer meteorological drought indices throughout Thailand. Research design Data input Technique used - “Kriging technique” GIS spatial Surfer, Arcview -The average every 4-years analysis in form of grid cell digital monthly values of drought maps of Thailand in scale 1: 250,000 severity during 1983-2002 from R 53 Meteorological Stations throughout Thailand E S E STEP 3 Digital Maps of Palmer Meteorological Drought Indices A Data input Technique used R C - Runoff and Potential runoff - Soil moisture index equation H - Loss and Potential loss - Palmer drought index’s classification - Extreme wet computation - ET and PET “Computer Program” - Extreme drought computation - Recharge and Potential recharge D - Monthly Precipitation values E Palmer met. drought index computation STEP 2 S Data input I Technique used G - Daily met. parameters like as N - PET computation using solar radiation, rainfall, air temp., Penman-Monteith equation humidity, and wind speed from “SWAP” 53 met. stations during 1983-2002 - Soil properties computation using Darcy and Richard equation - Soil data from LDD - Agricultural data from OAE Analytic tools STEP 1 Water balance computation Remark: LDD is Land Development Department of Thailand OAE is the office of Agricultural Economics of Thailand Methodology STEP 1: Water balance Computation 1. Data input : Daily meteorological data (solar radiation, rainfall, air temperature, relative humidity, wind speed), Soil data (Available Water Capacity, Field Capacity, Permanent Wilting Point, pH), and Agricultural data (the crop cultivation areas in district levels throughout Thailand). 2. Data processing: Using agrometeorological model so-called “SWAP” (Soil-Water-Atmosphere-Plant) by Kroes et al, 1999, Department of Water Resource, Wageningen Agricultural University of the Netherlands. 3. Output: Daily water balance parameters in along with 53 meteorological stations throughout Thailand (Potential water runoff, Water runoff, Potential water loss, Water loss, Potential water recharge, Water recharge, Potential evapotranspiration, and Evapotranspiration).

  3. STEP 2: Palmer meteorological drought index Computation 1. Data input: Results from STEP 1. 2. Data processing: Using a visual basic computer program with the approaches following; 1. To find out “Z”(a negative value continuously with a changing rate of accumulated “Z” in comparing with time as the maximum value in each met.station). 2. To construct a scatter plot graph of those accumulated “Z” in relating to a period of time (t) using the linear regression relationship: Σ Z(t) = mt + n ; m, n was constant values as shown on Figure 1. Consequently, it was able to generate the Palmer ( t ) z 1 . 13 meteorological drought index into X(t) = X(t-1) + - 1.35X(t-1). Accumulated z Index Vs Time(month) 0 5 10 15 20 0 accumulated_z -20 -40 -60 -80 Acc_z = -6.1002t - 1.5948 R 2 = 0.7606 -100 -120 accumulated_z time (month) Linear (accumulated_z) Figure 1. The relationship between accumulated Z and period of time t All used parameters in a computation of Palmer meteorological drought index would be shown as follow; Parameters Equations Meanings Coefficient of Evapotranspiration ( α ) α =ET/PE ET is actual Evapotranspiration PE is Potential Evapotranspiration Coefficient of Recharge ( β ) β =R/PR R is Recharge PR is Potential Recharge Coefficient of Runoff ( γ ) γ =RO/PRO RO is runoff PRO is Potential Runoff Coefficient of Loss ( δ ) δ =L/PL L is Loss PL is Potential Loss ET*= α PE CAFEC is Climatically Appropriate For CAFEC Precipitation (P*) Existing Conditions in that individual month; R*= β PR ET*, R*,RO*, L*, and P* RO*= γ PRO P* is precipitation L*= δ PL P*=ET*+R*+RO*-L* d is the difference between the actual Precipitation Excesses and Deficiencies (d) d=P-P* precipitation and the CAFEC precipitation for each month The Climatic characteristic (k) k= (PE+R)/(P+L) k is the first approximation climatic characteristics The Moisture anomaly index (z) z=dk z is the moisture anomaly index

  4. 3. Output: Using this existing equation, the outputs would have been the average every 4-years monthly values of drought severity in various levels along with all met. station throughout Thailand. STEP 3: Digital maps of Palmer meteorological drought indices 1. Data input: Results from STEP 2 by converting to a new format with a Georeferenced values for each met. station (Latitude, Longitude) in the GIS spatial analysis. 2. Data processing: The topographic map of Thailand in scale 1:250,000 as a base map in this study. All the average every 4-years monthly values of drought severity in various levels would be placed on corresponding to a location of each met. station throughout Thailand and then, a “Grid Cell Kriging interpolation technique” of GIS spatial analysis would have been used to analyze all related data. 3. Output: The grid cell digital maps of Palmer meteorological drought indices throughout Thailand in scale 1:250,000 showing the colorful severity of drought in various levels from –4.00 or less (Extreme drought) to 4.00 or more (Very much wetter than normal) as follow; Remarks: The average monthly values of the severity of Palmer meteorological drought indices in various levels throughout Thailand during January-March for period 1982- 1985 [brown (wild drought)-green (slight wet rather normal)]. The Future Research Works To validate an accuracy of the grid cell digital maps, which have been showing the severity of Palmer meteorological drought indices in any area of Thailand, therefore, the NDVI-NOAA-AVHRR imageries at the same period of time as a produced grid cell digital maps would be analyzed and found out a particular drought areas and then, a result would have been compared with a drought area in digital maps. This preliminary validating processes has been done using some data set as shown on Figures 2-3.

Download Presentation
Download Policy: The content available on the website is offered to you 'AS IS' for your personal information and use only. It cannot be commercialized, licensed, or distributed on other websites without prior consent from the author. To download a presentation, simply click this link. If you encounter any difficulties during the download process, it's possible that the publisher has removed the file from their server.

Recommend


More recommend