
SLIDE 1
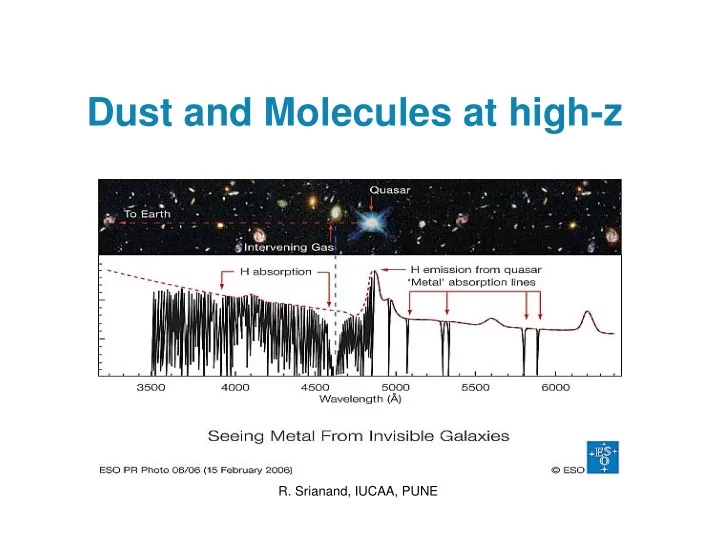
Dust and Molecules at high-z
- R. Srianand, IUCAA, PUNE
Dust and Molecules at high-z R. Srianand, IUCAA, PUNE C OLLABORATORS - - PowerPoint PPT Presentation
Dust and Molecules at high-z R. Srianand, IUCAA, PUNE C OLLABORATORS : Patrick Petitjean, IAP , France Neeraj Gupta, ASTRON, Netherlands Pasquier Noterdaeme, IAP , France Cedric Ledoux, ESO, Chile Sebastian Lopez,Universidad
, France
, France
Dust Meeting-2011 1
– H2 and HD absorption – CO molecule – 2175 ˚ A bump – DIBs
Dust Meeting-2011 2
Dust Meeting-2011 3
1 2 3 4 5 z 0.0 0.5 1.0 1.5 Ωg
DLA (× 10 −3)
2 4 6 7 8 9 10 11 12 lookback time (Gyr)
Noterdaeme et al. 2009, A&A, 505, 1087
Dust Meeting-2011 4
Dust Meeting-2011 5
Most of these have high metallicity absorbers−Moller et al., 2002
Dust Meeting-2011 6
1200 1205 1210 1215 1220 1225 1230 Rest Wavelength (Å) 5 10 15 20 25 Fλ (10−17 erg s−1 cm−2Å−1) SiIII weighted mean
1213.2 1214.8 1216.5 1218.2 −0.5 0.0 0.5 1.0 0.0 0.4 0.8 1.2
CIIλ1334
0.0 0.2 0.4 0.6 0.8 1.0 log(1+z) 0.01 0.10 ρ*( MO
.
Rahmani et al. 2010
Dust Meeting-2011 7
Dust Meeting-2011 8
Dust Meeting-2011 9
Dust Meeting-2011 10
Petitjean et al. 2000; Ledoux et al. 2003; Srianand et al. 2005; Noterdaeme et al. 2008 & Srianand et al. 2011
Dust Meeting-2011 11
physical state of the gas.
Dust Meeting-2011 12
this component is less than 10 pc.
Dust Meeting-2011 13
spectrum of QSOs. 45 strong systems found.
Lyman-α emission from the QSOs so one can search for them at z ≥ 1.5.
at different environments.
Dust Meeting-2011 14
Dust Meeting-2011 15
Dust Meeting-2011 16
Dust Meeting-2011 17
0.0 0.2 0.4 0.6 0.8 1.0 fH2 0.01 0.1 1.0 10 100 N(CO)/N(C0)
Translucent Diffuse
0.0 0.2 0.4 0.6 0.8 1.0 fH2 10−8 10−7 10−6 10−5 10−4 N(CO)/N(H2)
Translucent Diffuse
Dust Meeting-2011 18
0.0 0.5 1.0 1.5 2.0 2.5 3.0 z 2 4 6 8 10 12 14 TCMB (K)
TCMB
0 (1+z)
TCMB
0 (1+z) (1−β)
with β = −0.007 ± 0.027.
et al. 2010, TCMB(z) = TCMB(z = 0) × (1 + z)3γ−1 (m − 3Ωm) + x(1 + z)m−3(Ωm − 1) (m − 3)Ωm γ Where, γ = 4/3, Ωm = 0.275 ± 0.015 and m=3(weff + 1) with weff = p/ρ. The best fitted value is weff = −0.996 ± 0.025.
Noterdaeme et al. 2011, A&AL, 526, L7
Dust Meeting-2011 19
with X-SHOOTER.
strong H2 and HD molecules.
selection but for other reasons.
absorbers. Srianand et al. 2008; Noterdaeme et al., 2009; 2010; 2011
Dust Meeting-2011 20
Dust Meeting-2011 21
Dust Meeting-2011 22
Dust Meeting-2011 23
Dust Meeting-2011 24
Dust Meeting-2011 25
Dust Meeting-2011 26
Dust Meeting-2011 27
– N(H I) = (5.73±1.10)×1021 cm−2 – Ts ∼ 190+124
−69 K
– N(H I) = 6.97±1.30 × 1021 cm−2 – Ts/fc = 536+234
−88 K.
Dust Meeting-2011 28
Dust Meeting-2011 29
(Kulkarni et al. 2011, ApJ, 726, 14)
using VLT.
ApJ, 732, 110.
Dust Meeting-2011 30
Dust Meeting-2011 31
400 600 800 1000 1200 1400 1600
5 10 15 20 25 30 Fλ (10−17 erg s−1 cm−2Å−1) QSO composite J1135−0010 QSO composite, AV=0.11
Dust Meeting-2011 32
1120 1140 1160 1180 1200 DECLINATION (J2000) RIGHT ASCENSION (J2000) 12 42 00 41 59 58 57 56 55 54 63 32 46 44 42 40 38 36 34 32
1160 1180 1200 1220 DECLINATION (J2000) RIGHT ASCENSION (J2000) 11 10 28 27 26 25 24 23 22 21 03 21 55 50 45 40 35 30 25 20 15
Gupta et al. 2010
Dust Meeting-2011 33
Dust Meeting-2011 34
0.5 1 1.5 10 20 30 0.5 1 1.5 10 20 30
Dust Meeting-2011 35
normal interstellar medium conditions.
selection of QSOs. New selection is needed.
A feature is detected at high-z. DIBs are still elusive for z ≥ 0.5.
Dust Meeting-2011 36