DURABILITY EVALUATION OF THE COMPOSITE BOGIE FRAME UNDER DIFFERENT - - PDF document

durability evaluation of the composite bogie frame under
SMART_READER_LITE
LIVE PREVIEW

DURABILITY EVALUATION OF THE COMPOSITE BOGIE FRAME UNDER DIFFERENT - - PDF document

18 TH INTERNATIONAL CONFERENCE ON COMPOSITE MATERIALS DURABILITY EVALUATION OF THE COMPOSITE BOGIE FRAME UNDER DIFFERENT SHAPES AND LOADING CONDITIONS Jung-Seok Kim 1 *, Hyuk-Jin Yoon 1 , Sung-Hoon Lee 1 , Woo-Geon Lee 1 , Kwang-Bok Shin 2 1


slide-1
SLIDE 1

18TH INTERNATIONAL CONFERENCE ON COMPOSITE MATERIALS

1 Introduction The bogie of a railway vehicle sustains the weight

  • f the car body, controls the wheel sets on straight

and curved track, and absorbs the vibrations [1]. The weight of the bogie makes up approximately 37% of the total vehicle weight. Therefore, reducing the weight of the components making up the bogie system is essential for lightweight railway vehicle

  • design. In particular, a bogie frame, which accounts

for approximately 20% of the bogie weight, is intended to support heavy static and dynamic loads, such as the vertical load by the body of the vehicle, braking and accelerating load, twisting load induced by track twisting, and traction load. This is why it is common to produce bogie frames with solid steel (especially a freight bogie) or welded structures. Such bogie frames are rigid and heavy, weighing from 1 to 2 tons. They have to be equipped with suspension and damping systems to safeguard the comfort of passengers and to absorb vibrations due to the unevenness of the railway track on which the vehicles run [2-5]. Usually, the bogie of urban subway trains is subjected to much more load variation than passenger trains due to passenger weight difference between the full weight condition during rush hour and the tare weight condition. The passenger weight difference of the urban subway train is in the range

  • f 25tones to 30tones while in case of the passenger

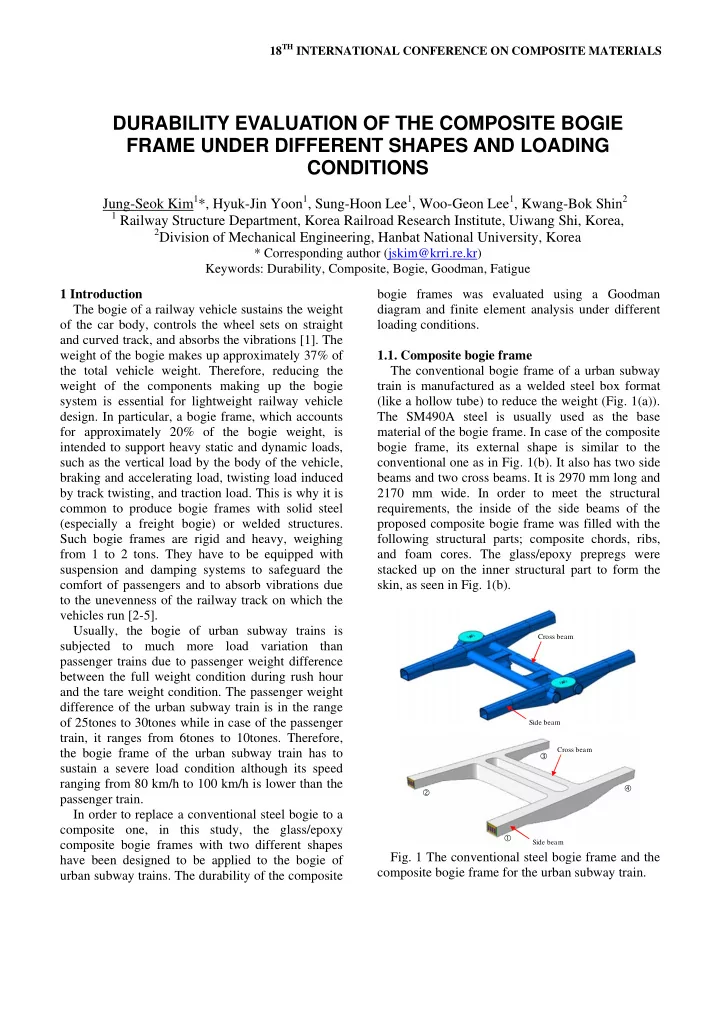
train, it ranges from 6tones to 10tones. Therefore, the bogie frame of the urban subway train has to sustain a severe load condition although its speed ranging from 80 km/h to 100 km/h is lower than the passenger train. In order to replace a conventional steel bogie to a composite one, in this study, the glass/epoxy composite bogie frames with two different shapes have been designed to be applied to the bogie of urban subway trains. The durability of the composite bogie frames was evaluated using a Goodman diagram and finite element analysis under different loading conditions. 1.1. Composite bogie frame The conventional bogie frame of a urban subway train is manufactured as a welded steel box format (like a hollow tube) to reduce the weight (Fig. 1(a)). The SM490A steel is usually used as the base material of the bogie frame. In case of the composite bogie frame, its external shape is similar to the conventional one as in Fig. 1(b). It also has two side beams and two cross beams. It is 2970 mm long and 2170 mm wide. In order to meet the structural requirements, the inside of the side beams of the proposed composite bogie frame was filled with the following structural parts; composite chords, ribs, and foam cores. The glass/epoxy prepregs were stacked up on the inner structural part to form the skin, as seen in Fig. 1(b).

Side beam Cross beam Side beam Cross beam

  • Fig. 1 The conventional steel bogie frame and the

composite bogie frame for the urban subway train.

DURABILITY EVALUATION OF THE COMPOSITE BOGIE FRAME UNDER DIFFERENT SHAPES AND LOADING CONDITIONS

Jung-Seok Kim1*, Hyuk-Jin Yoon1, Sung-Hoon Lee1, Woo-Geon Lee1, Kwang-Bok Shin2

1 Railway Structure Department, Korea Railroad Research Institute, Uiwang Shi, Korea, 2Division of Mechanical Engineering, Hanbat National University, Korea

* Corresponding author (jskim@krri.re.kr) Keywords: Durability, Composite, Bogie, Goodman, Fatigue

slide-2
SLIDE 2

2 Test and Simulation 2.1 Test for Fatigue Limit Usually, the composite bogie frame is under an alternating load condition. Therefore, the fatigue test

  • f the 4-harness glass/epoxy composite with fiber
  • rientation 0/90o used to the bogie frame was

conducted on symmetrical sinusoidal cyclic loading, R= -1 and the loading frequency of 5 Hz was selected to ignore temperature rise in the test specimen during the fatigue test [6]. Before the fatigue test, the static test was performed in tension and compression to obtain the failure strength in each direction. Fig. 1 displays the S-N curve.

10

2

10

3

10

4

10

5

10

6

10

7

20 40 60 80 100

s max/sult (%) Fatigue life (Log(N))

  • Fig. 2 S-N curve of the 4-harness glass/epoxy.

2.2 Finite Element Analysis The finite element analysis was carried out for two composite bogie frames with different side beam heights of 50mm and 150mm (Fig. 3(a)-(b)).

  • Fig. 6 shows the finite element modeling and the

boundary conditions of the composite bogie frame. Except for the air spring seats other brackets used to install the sub-components such as the braking device, dampers, and traction devices were not included in the FE model. In order to apply the loads to the locations of such brackets, nodes were modeled at these points and connected with the bogie frame with MPC constraints. For the finite element analysis of the composite bogie frame, the composite chords and ribs were modeled with C3D8R solid elements and the foam cores were modeled using C3D8I solid elements. The skin part was modeled using S4R layered shell elements. The layup structure definition (such as the fiber

  • rientation, ply thickness, local coordinate definition,

and number of integration points through the ply thickness) of the three composite parts, excluding the foam core, was completed using the composite layup module supplied by ABAQUS [7]. The layered shell elements of the skin part were connected with the inner parts meshed by the solid elements using tie constraints.

Side beam bottom Outer joint-1 Outer joint-2 Joint center 50mm 150mm A A

(a) (b)

  • Fig. 3 Two composite bogie frame models with

different side beam heights. Table 1 Load cases applied to a bogie frame.

Load case Stress symbol Load value (kN) Remark Vertical load A 140 Static (1.0g) B 182 Dynamic (1.3g) Twisting load C1 16mm displacement 1,4 position C2 16mm displacement 2,3 position Traction load D1 95 Running forward D2 95 Running backward Lateral load E1 95 Left E2 95 Right Braking load F1 50 Running forward F2 50 Running backward

923.5mm 1050mm 1300mm Loading point 1 Loading point 2 Loading point 3 Center of the bogie frame

  • Fig. 4 Three different application points of the

vertical load.

slide-3
SLIDE 3

3 DURABILITY EVALUATION OF THE COMPOSITE BOGIE FRAME UNDER DIFFERENT SHAPES AND LOADING CONDITIONS

Five load cases listed in Table 1 were applied to each bogie frame to obtain the critical location and stress [8]. Among such load cases, the vertical load was imposed on three different positions as shown in

  • Fig. 3. Therefore, the durability of the bogie frame

under six load sets (three load sets for each bogie frame) was evaluated. 3 Results 3.1 Failure index distributions In order to evaluate the structural safety of the composite bogie frame under various loading conditions, the Tsai-Wu failure index was calculated and evaluated. The Tsai-Wu failure index was calculated using Eq. (1).

. 1 2

22 11 12 2 12 66 2 22 22 2 11 11 22 2 11 1

= + + + + + σ σ σ σ σ σ σ F F F F F F

(1) Where and are strength tensors and is the calculated stress.

  • Figs. 5 and 6 show the stress analysis results for the

composite bogie frame with the side beam heights of 150mm.

(a) (b)

  • Fig. 5 Tsai-Wu failure index contours under: (a)

vertical load, (b) +twisting load.

  • Fig. 5 shows the Tsai-Wu failure index contours

under vertical (Fig. 5(a)) and +twisting (Fig. 5(b))

  • loadings. Under the vertical loading, the maximum

Tsai-Wu failure index occurred at the bottom joint region between the side beam and the cross beam and took a value of 0.23. In case of the +twisting loading, a high Tsai-Wu failure index occurred at the same region as the vertical loading condition and was 0.48. However, the maximum Tsai-Wu failure index appeared to be at the points in which the MPC constraints for the lateral buffer were applied to connect the two cross beams. In the real composite frame, steel brackets will be assembled not only to connect the two cross beams but also to install the lateral buffer at these points. From the analysis results, therefore, it is expected that the steel brackets will be subjected to severe torsional loads under the twisting loading conditions.

(a) (b)

  • Fig. 6 Tsai-Wu failure index contours under: (a)

traction load, (b) braking load.

  • Fig. 6 shows the Tsai-Wu failure index contours

under traction (Fig. 6(a)) and braking (Fig. 6(b))

  • loading. Under the traction loading, the maximum

Tsai-Wu failure index occurred at the points in which the MPC constraints were applied and was 0.11. Except for these points, the index was lower than 0.1. In the case of the braking loading, a high Tsai-Wu failure index occurred around the joint region between the side beam and the cross beam and the maximum value was 0.15. Table 2 The maximum Tsai-Wu failure index for the two bogie configuration.

Loadings Side beam heights 150mm 50mm Vertical (1.0g) 0.23 0.49 +Twisting 0.48 0.57 Traction 0.11 0.13 Braking 0.15 0.15 Lateral 0.13 0.16

slide-4
SLIDE 4

Table 2 summarizes the maximum Tsai-Wu failure indexes for the two bogie frames. From the information of Table 2, it can be observed that, under the vertical load, the maximum Tsai-Wu failure index of the composite bogie frame with side beam heights of 50mm was increased by 113% relative to the composite bogie frame with side beam heights of 150mm. However, the increase was less than 23% under other loading conditions.

(a)

  • 600
  • 400
  • 200

200 400 600 20 40 60 80 100 120

Endurance limit Side beam bottom Outer joint area Joint center area

Stress amplitude (MPa) Mean Stress (MPa) Side beam bottom Outer joint area Joint center area

(b)

  • 600
  • 400
  • 200

200 400 600 20 40 60 80 100 120

Endurance limit Side beam bottom Outer joint area Joint center area

Stress amplitude (MPa) Mean Stress (MPa) Side beam bottom Outer joint area Joint center area

  • Fig. 7 Goodman diagram for the two bogie

configurations: (a) bogie frame with side beam heights of 50mm, (b) bogie frame with side beam heights of 150mm. 3.2 Durability evaluation In the previous section, the structural safety of the composite bogie frame was assessed for individual static loading conditions. In this section, the durability of the composite bogie frame is evaluated using Goodman diagram. From the stress values calculated from the finite element analysis, the mean stress and stress amplitude was obtained using Eq. (2) and (3) [8].

( ) ( ) ( ) ( ) ( )

2 2 2 2

2 1 2 1 2 1 2 1

F F E E D D A C A C A

m

+ + + + + + − + − + = σ

(2)

( ) ( ) ( ) ( ) ( ) ( ) 2

2 1 2 2 1 2 2 1 2 2 1 2

} 2 { } 2 { } 2 { } 2 { F F E E D D A C A C A B

a

− + − + − + − + − + − = σ

(3)

  • Fig. 7 plots the Goodman diagrams for the two

composite bogie frames with side beam heights of 50mm and 150mm, respectively, under the ten load cases listed in Table 1. The data of the diagram were selected from the three critical areas of each bogie frame: the side beam bottom, outer joint area, and joint center area. Based on the diagram, the side beam bottom area was determined to be the critical region in the bogie frames with side beam height of

  • 50mm. In contrast, in the bogie frames with side

beam height of 150mm, the joint center area revealed higher mean stress and stress amplitude values than the other parts. The stress data of the two models were within the endurance limit. 4 Conclusions From the analysis results, the two types of composites met the static structural safety requirements under ten different loading conditions. The maximum Tsai-Wu failure indexes of the two composite bogie frames were 0.48 and 0.57, and the values occurred under the twisting load. In the durability evaluation using Goodman diagrams, it was clear that the two models would be safe under the fatigue loading conditions. The critical point was the side beam bottom area for the bogie frames with side beam height of 50mm, while the joint center area revealed higher mean stress and stress amplitude values in the bogie frames with side beam height of 150mm. References

[1] Jung Seok Kim. Fatigue assessment of tilting

bogie frame for Korean tilting train: Analysis and static tests. Eng. Fail. Ana. 2006;13:1326- 1337.

[2] Geuenich, W., Guenther, C. and Leo, R.,

“Dynamics of Fiber Composite Bogies with

slide-5
SLIDE 5

5 DURABILITY EVALUATION OF THE COMPOSITE BOGIE FRAME UNDER DIFFERENT SHAPES AND LOADING CONDITIONS

Creep-controlled Wheelsets,” 8th IAVSD- Symposium MIT, pp. 225-238, 1983.

[3] Guenther, C., Leo, R. and Wackerle, P., “New

Technologies for Rail Vehicle Bogies and Car Body Substructures,” MRS, Europe, pp. 89-95, 1985.

[4] Leo, R. and Lang, H. P., “Fiber-composite

Bogies on Test,” Railway Gazette International,

  • pp. 632-633, 1986.

[5] Maurin, L., Boussoir, J., Rougeault, S., Bugaud,

  • M. and Ferdinand, P., “FBG-based Smart

Composite Bogies for Railway Applications,” IEEE, pp. 91-94, 2002.

[6] Hwang, W. B. and Han, K. S., “Fatigue of

composites fatigue modulus concept and life prediction,” JCM. Vol. 20, pp. 154-165, 1986.

[7] ABAQUS manual, Simulia. [8] Minister of Land, Transport and Maritime

Affairs: Standard for performance test of the urban subway train, 2008.