Dormancy and Chilling Fulfillment in Grapevine Timing of dormancy - - PowerPoint PPT Presentation

dormancy and chilling fulfillment in grapevine timing of
SMART_READER_LITE
LIVE PREVIEW

Dormancy and Chilling Fulfillment in Grapevine Timing of dormancy - - PowerPoint PPT Presentation

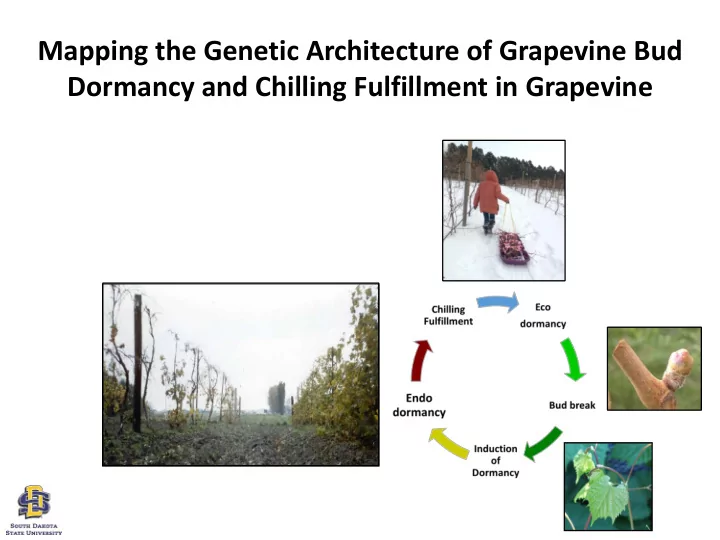
Mapping the Genetic Architecture of Grapevine Bud Dormancy and Chilling Fulfillment in Grapevine Timing of dormancy induction and release are critical for sustainable grapevine production in changing climate. Develop and use a genetic model


slide-1
SLIDE 1

Mapping the Genetic Architecture of Grapevine Bud Dormancy and Chilling Fulfillment in Grapevine

slide-2
SLIDE 2

Timing of dormancy induction and release are critical for sustainable grapevine production in changing climate.

Develop and use a genetic model system to identify key factors controlling

  • Dormancy induction
  • Chilling Fulfillment
  • Budbreak timing
  • Fall, winter and spring freeze

tolerance

slide-3
SLIDE 3

Genetic System

  • V. riparia
  • Tolerates extreme low temperature
  • Decreasing daylength induces

dormancy and acclimation

Seyval

  • Moderately freezing tolerant.
  • Low temperature promotes dormancy.

F1 (16_9_2)

  • Intermediate photoperiod and

dormancy responses

F2 population

  • Fruit quality, architecture, chilling

fulfillment, sex, dormancy induction, freezing tolerance, fruit ripening period

(Fennell, Mathiason, Luby 2005)

Seyval Vitis riparia X Single F1 Selfed (16-9-2) F2 population

Luby UMN

F1 population Screen for photoperiod induced dormancy (Fennell SDSU)

slide-4
SLIDE 4

Phenotyping initiated prior to linkage map availability.

  • 110 individuals placed in 2

field locations (SD and MN) and original vines in controlled environment.

  • Photoperiod and low

temperature response phenotypes measured in multiple years.

  • Field conditions and

controlled temperature and photoperiod conditions.

slide-5
SLIDE 5

Decreasing photoperiod induces growth cessation and early dormancy promoting winter survival. F2 population segregates for photoperiod and dormancy induction responses.

Shoot tip abscission

r=0.45 r=0.53 summer lateral

Summer lateral emergence Bud assay for dormancy status

Photoperiod Response QTLS identified on linkage groups 11, 12, 13 using SSR map (Garris et al. 2009)

slide-6
SLIDE 6
  • 0.0003
  • 0.00025
  • 0.0002
  • 0.00015
  • 0.0001
  • 0.00005
  • 25
  • 20
  • 15
  • 10
  • 5

voltage °C

LTE

Lethal bud freezing temperature determined by monitoring low temperature exotherm (LTE) using differential thermal analysis. (Mills et al., 2006). Bud LTE measured in Nov., Dec., Jan. and Feb. in five dormant seasons.

Timing of dormancy induction influences timing of cold

  • acclimation. F2 population segregates for acclimation

responses.

LTE °C LTE °C

10 20 30

  • 35
  • 33
  • 31
  • 29
  • 27
  • 25
  • 23
  • 21

Nov.11 Dec.11

# genotypes

10 20 30

  • 35 -33 -31 -29 -27 -25 -23 -21

Jan.14 Feb.14

slide-7
SLIDE 7
  • F2 map generated with 1,449 GBS

markers from 424 individuals

  • 2424 cM in genetic length
  • Genome coverage 95%
  • Average distance between markers
  • f 1.67 cM
  • Mapping protocol, YAN and malate

metabolism QTLS & candidate genes

slide-8
SLIDE 8

Photoperiod response QTLs are identified in multiple years in field and controlled environment conditions. Lateral growth cessation, tip abscission and dormancy induction QTLs explain 10 to 20% of phenotypic variation.

Trait

  • No. of

individuals Linkage Group Position LOD score Phenotypic variation (R2) Mean lateral cessation 87 12 60.115 3.90 17.97 Critical Photoperiod GH Mean 106 11 98.89 5.57 14.80 Mean lateral cessation 106 12 55.45 4.03 10.20 Mean tip abscission 106 11 98.890 4.17 14.70

Dormancy, chilling fulfillment and LTE QTLs on linkage groups 4, 11, 13 or 18 explain 12 to 25% of phenotypic variation.

slide-9
SLIDE 9

Haplotypes associated with the QTLs indicate genotypes in common between critical photoperiod, growth cessation, and long term winter survival.

AA – V. riparia grandparent H – Heterozygote BB – Seyval grandparent AA BB H Vine Winter Survival Score

slide-10
SLIDE 10

Summary

  • Multi-year dormancy and winter survival trait

analyses identified multiple QTLs explaining 10 to 25% of phenotypic variation.

  • Use of haplotype analysis provides ability to select

individuals that have multiple desired traits for further breeding or functional analysis.

  • F2 Population is being propagated and established

in replicated planting to allow more rapid fruit, architecture and viticultural trait analyses.

slide-11
SLIDE 11

Acknowledgements:

  • Dilmini Alahakoon
  • Mani Awale
  • Kalley Besler
  • Matthew Clark
  • Jim Luby
  • Jonathan Fresnedo- Ramirez
  • Shanshan Yang