Disclosures Masking and Breast Density Volpare Health Solutions - - PowerPoint PPT Presentation

disclosures
SMART_READER_LITE
LIVE PREVIEW

Disclosures Masking and Breast Density Volpare Health Solutions - - PowerPoint PPT Presentation

6/8/2017 Disclosures Masking and Breast Density Volpare Health Solutions (Wellington, New Zealand) Can we Quantify Masking Risk? co-founder and shareholder Qview Medical (Los Altos, CA) Nico Karssemeijer consultant, co-founder and


slide-1
SLIDE 1

6/8/2017 1

Masking and Breast Density Can we Quantify Masking Risk?

Nico Karssemeijer Diagnostic Image Analysis Group Radboud University Nijmegen The Netherlands

Disclosures

Volpare Health Solutions (Wellington, New Zealand) co-founder and shareholder Qview Medical (Los Altos, CA) consultant, co-founder and shareholder ScreenPoint Medical (Nijmegen, Netherlands) CEO, co-founder, Shareholder

  • What is masking?
  • Masking and interval cancers
  • Determining the risk of masking in mammograms
  • BI-RADS
  • Density measurement
  • Model based methods
  • Breast compression and masking

Overview

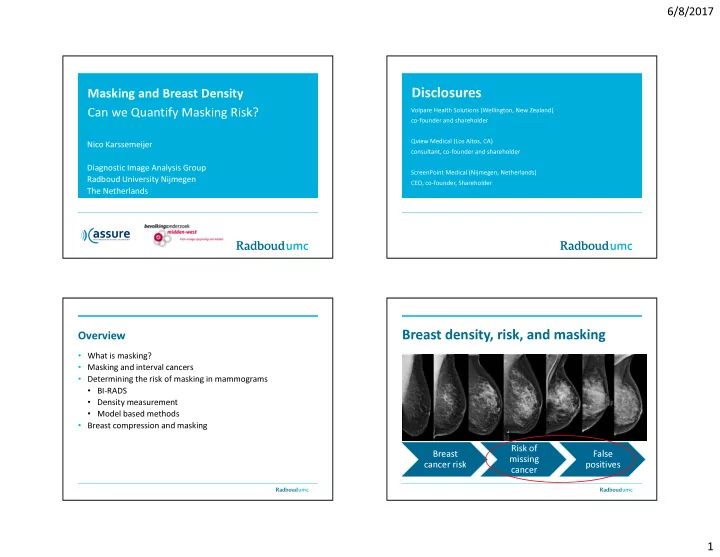
Breast density, risk, and masking

Breast cancer risk Risk of missing cancer False positives

slide-2
SLIDE 2

6/8/2017 2

Breast density and screening sensitivity in the Netherlands

Population based screening program – Age group 50-74 – Two year interval - Digital Mammography

Total VDG 1 % VDG2 % VDG3 % VDG 4 % N 111898 24,210 21.6 46,426 41.5 32,330 28.9 8932 8.0 Screen- detected 667 96 298 212 61 Interval 234 16 86 93 39 FP 1774 271 700 590 213 TN 109,223 23,827 45,324 32,279 8912

Breast density and screening sensitivity in the Netherlands

Total VDG 1 VDG2 VDG3 VDG 4 Recall / 1000 21.8 15.2 21.7 24.8 30.7 FP / 1000 15.9 11.4 15.1 18.2 23.8 Screen-detected / 1000 5.9 4.0 6.4 6.6 6.8 Interval / 1000 2.1 0.7 1.9 2.9 4.4 BC / 1000 8.1 4.6 8.3 9.4 11.2 Sensitivity 74,0% 85.7% 77.6% 69.5% 61.0% Specificity 98,4% 98.9% 98.5% 98.2% 97.6% PPV 27,3% 26.2% 29.9% 26.4% 22.3%

Breast density and screening sensitivity in the Netherlands – Only invasive cancers

Total VDG 1 VDG2 VDG3 VDG 4 Recall/1000 20.6 14.3 20.5 23.3 28.5 FP/1000 15.9 11.2 15.1 18.3 23.9 Screen-det /1000 4.7 3.1 5.4 5.0 4.6 Interval/1000 2.1 0.6 1.8 2.8 4.4 BC/1000 6.9 3.7 7.2 7.9 9.0 Sensitivity 69.1% 83.3% 74.5% 62.9% 50.6% Specificity 98.4% 98.9% 98.5% 98.2% 97.6% PPV 23.0% 21.7% 26.9% 21.6% 16.1%

slide-3
SLIDE 3

6/8/2017 3 Sensitivity for invasive cancer in age groups 831,455 exams

Comparison Wanders et. al. (top) and Kerlikowske et. al. (bottom)

Volpara VDG 1 VDG2 VDG3 VDG 4 Distribution % 21.6 41.5 28.9 8.0 Sensitivity % (invasive) 83.3 74.5 62.9 50.6 Specificity % 98.9 98.5 98.2 97.6 BI-RADS 1 2 3 4 Distribution % 11.7 40.8 39.4 8.1 Sensitivity % (invasive) 81.2 84.3 68.9 63.3 Specificity % 94.4 90.2 88.0 90.8

slide-4
SLIDE 4

6/8/2017 4

slide-5
SLIDE 5

6/8/2017 5

slide-6
SLIDE 6

6/8/2017 6

slide-7
SLIDE 7

6/8/2017 7

Can we quantify masking risk ?

  • BI-RADS
  • Automated density assessment
  • Volumetric
  • 2D
  • Use a model to predict masking
  • Analytic
  • Machine learning
  • Observer models
  • Evaluate methods by measuring how well they can determine

interval cancer risk

Cancers may be hidden in dense tissue. X-ray attenuation of cancers and dense tissue is about the same.

Compression paddle Detector / Imager

Also if not ‘inside’ dense tissue a cancer may be

  • masked. It that case the other view (CC or MLO) may

help.

Compression paddle Detector / Imager

In this case the cancer will not be masked in any view

Compression paddle Detector / Imager

slide-8
SLIDE 8

6/8/2017 8

If an overlapping layer of dense tissue it thin the cancer may well be visible

Compression paddle Detector / Imager

Texture plays a role. If a cancer looks like other patches

  • f dense tissue it will be hard to detect (priors may

help)

Compression paddle Detector / Imager

Calcifications are not masked. Their X-ray attenuation is much larger.

Compression paddle Detector / Imager

Masking risk quantification

(Katharina Holland, Radboud Nijmegen)

  • PDA : Percentage dense area
  • VGT : Volume of glandular tissue
  • PDV : Percentage dense volume
  • PA1 : Percent area with dense tissue thickness > 1cm
  • DTMM: Detectability model based on volumetric density maps
slide-9
SLIDE 9

6/8/2017 9

Volumetric Density Maps The simplest model

  • VGT : Volume of glandular tissue
  • PDV : Percentage dense volume = VGT / breast volume1

area breast

dxdy y x d ) , (

1 P. R. Snoeren and N. Karssemeijer (2004) IEEE Trans Med

Replace dense tissue thickness with ‘masking’ measure

  • M(x,y) = 0 : no risk of a masked cancer at that location
  • M(x,y) = 1 : Cancers always masked

area breast

dxdy y x m ) , (

PA1: Aassume that a lesion is detectable when dense tissue layer is less than 1 cm thick.

Compression paddle Detector / Imager Detectable Not detectable

slide-10
SLIDE 10

6/8/2017 10

Use tumor size distribution

10 20 30 40 50 5 10 15 20 25 30 35 40 45 50 Effective diameter distribution screen detected cancers (mm)

Masking measure m(x,y) depends on dense tissue thickness and lesion size H

0.2 0.4 0.6 0.8 1 1.2 10 20 30 40 m d (mm) step function sigmoid at 1 cm sigmoid at 2 cm 0.2 0.4 0.6 0.8 1 1.2 0.5 1 m d/H 0.25 H 0.5 H

Normalization

Avoid that large breasts have a higher masking risk than small breasts

  • Normalization with the breast area
  • Normalization with a cancer location probability distribution

(CLPD) p(x,y)

× dxdy y x m y x p ) , ( ) , (

Lesion location distribution

slide-11
SLIDE 11

6/8/2017 11

Evaluation

Images for the Dutch breast cancer screening program

  • 2003-2011 complete cancer status
  • > 200.000 exams of > 60.000 women
  • 93 interval cancers diagnosed within 12 months from

screening

  • 930 randomly selected controls
  • average results of the left and right MLO image

Effect of normalization Comparison of the methods

  • Study Material: Last negative screening mammogram of 111

interval cancers (within 12 months) and 1110 normal mammograms

  • Masking measures:
  • VDG
  • Volumetric Density (Volpara)
  • PDA
  • Percent Area with dense tissue thickness > 1 cm
  • DTMM
  • Mathematical Masking Model
  • BI-RADS
slide-12
SLIDE 12

6/8/2017 12 Evaluation of Masking Measures

Potential reduction of interval cancers by supplemental screening

Can we do better?

  • Context (texture) should be included
  • More complex models that take into account MLO and CC

views

  • Observer models may be used
  • Detectability can also be quantified with machine learning

Computing lesion detectability

  • Local noise estimation
  • Volumetric density map
  • Assume lesion has Gaussian profile, width 5 mm.
  • Using model observer to compute detectability
slide-13
SLIDE 13

6/8/2017 13

Machine Learning

  • Use deep learning to recognize patterns that are more likely to

hide cancers

  • Train with patterns extracted from interval cancers and screen-

detected cancers

Deep learning architecture

  • Deep learning architecture:
  • patches at multiple scales
  • supervised and unsupervised part
  • utput: risk score (for each image)

Michiel Kallenberg et al, University of Copenhagen

Experiments

  • Dataset:
  • 109 interval cancers
  • 285 screen detected cancers
  • Raw data
  • Interval cancers: last screening mammogram before interval

cancer occurred (contralateral breast)

  • Screen detected cancers: contralateral breast
  • Five fold cross validation
  • Volpara density grades
  • Compute odds ratios
slide-14
SLIDE 14

6/8/2017 14 Results:

VDG 1+2 (cancer/control) VDG 3+4 (cancer/control) Q 3+4 21/38 54/105 Q 1+2 29/127 5/15

Results:

texture: Q 3+4 vs Q 1+2: Deep learning tecturs: OR 2.19 (1.37-3.49) Density: OR 1.63 (1.04-2.53)

VDG 1+2 (cancer/control) VDG 3+4 (cancer/control) Q 3+4 21/38 54/105 Q 1+2 29/127 5/15 VDG 1+2 (cancer/control) VDG 3+4 (cancer/control) Q 3+4 21/38 54/105 Q 1+2 29/127 5/15

Examples Examples

Low density/ low texture risk score high density/ high texture risk score

slide-15
SLIDE 15

6/8/2017 15 Examples

high density/ low texture risk score low density/ high texture risk score

Examples

low density/ high texture risk score: textural masking

Compression and masking

(presented at RSNA 2016)

  • Breast compression may have a different effect on lesions and

the surrounding breast tissue

  • Does compression influence detectability?
  • Compression pressure can be measured with image analysis

Compression and masking

Too much compression may reduce visibility of lesions in spot compressions (Sylvia Heywang-Kohbrunner) “Small lobular carcinomas may disappear with strong compression, so spot views in particular may be misleading in very early lesions.”

slide-16
SLIDE 16

6/8/2017 16

Measurement of compression

  • Mean compression pressure is obtained by dividing force by

area of the contact surface

  • Contact area is computed by modeling the 3D breast shape

and digital image analysis

Pressure = Force / Contact Area

Computing the contact surface

Images from Thesis of Jerry de Groot, University of Amsterdam

  • Fig. 2

Branderhorst W , de Groot JE , Highnam R , Chan A , Böhm-Vélez M , Broeders MJ den Heeten GJ , Grimbergen CA . European Journal of Radiology 2015 84, 596-602

Force and pressure in two screening centers in NL and US

Screening performance and pressure

Pressure:

Very Low Low Medium High Very High

Total

26,496 26,535 26,634 26,535 26,583

Screen detected cancers

177 162 190 152 152

Interval cancers within 30 months

43 58 51 69 73

Interval cancers within 12 months

19 15 13 26 37

False positive examinations

486 381 404 426 495

slide-17
SLIDE 17

6/8/2017 17

Stratification by pressure

Group 1 Group 2 Group 3 Group 4 Group 5 Number examinations 26,496 26,535 26,634 26,553 26,583 Upper limit of pressure (kPa) 7.74 9.26 10.8 13.0

  • Mean breast

volume (cm3) 1511 1136 928 755 540 Mean breast density (%) 5.7 6.6 7.5 8.4 10.7

Analysis

  • Analyzed trends in sensitivity and specificity
  • Correction for confounders needed because
  • Sensitivity decreases with higher breast density
  • Women with small breasts have higher density and higher pressure
  • Method of Generalized Estimating Equations (GEE) was used

for corrections

  • Fact that multiple exams of women were included was

accounted for

  • Correction for multiple testing

Screening Performance and Pressure

(Corrected for confounders with GEE)

Group 1 Group 2 Group 3 Group 4 Group 5 Recall/1000 26.1 20.8 22.0 21.0 22.2 False positives/1000 20.0 14.9 15.0 15.2 16.2 Screen-detected cancers/1000 6.1 5.8 7.0 5.7 5.9 Interval cancers/1000 1.5 2.0 1.7 2.3 2.3 Program sensitivity (%) 79.5 73.2 78.9 69.9 70.3 12 month sensitivity (%) 90.1 91.9 94.0 87.2 84.3 Specificity (%) 98.0 98.5 98.5 98.5 98.4 Positive predictive value (%) 23.5 28.4 31.7 27.3 26.7

  • Fig. 2

Pressure groups in two screening centers in NL and US

13.0 10.8 7.7 9.3

slide-18
SLIDE 18

6/8/2017 18

Subtypes and pressure

All Cancers Screen Detected Interval

  • 261,641 mammography exams
  • Compression pressure measured and divided in tertiles
  • High pressure associated with higher odds for interval cancers

(OR 1.89)

Summary

  • Masking measures can be developed that outperform density
  • Context / texture should be included
  • Using cancer location distribution as prior knowledge in

models can improve masking measures

  • Calcifications are not masked by density
  • Breast compression may be a factor to take into account

Ritse Mann Katharina Holland Michiel Kallenberg Mads Nielsen Carla van Gils Hanneke Wanders Supported by Bevolkingsonderzoek Midden-West