
SLIDE 1
Disadvantaged Business Enterprise (DBE) 2021-2023 Goal Setting Stakeholders Meeting May 28, 2020
Welcome! While we wait to begin, please note the following:
- This is a Zoom webinar, so you will
not see your video image onscreen.
- All attendee audio is muted.
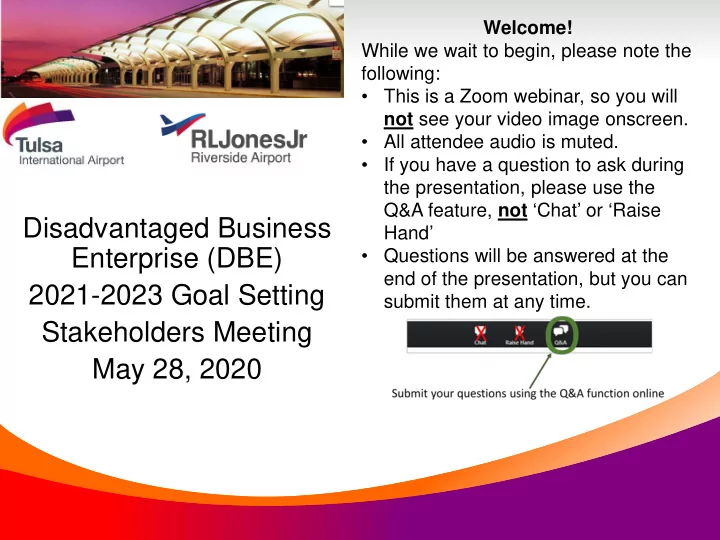
- If you have a question to ask during
the presentation, please use the Q&A feature, not ‘Chat’ or ‘Raise Hand’
- Questions will be answered at the
end of the presentation, but you can submit them at any time.