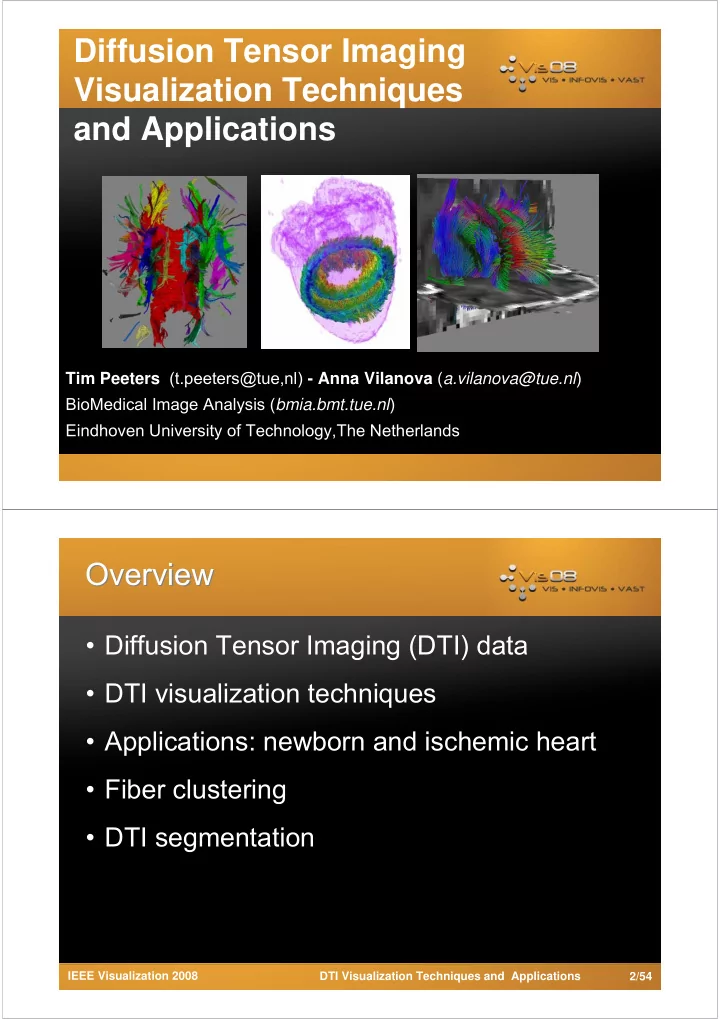
SLIDE 23 DTI Visualization Techniques and Applications IEEE Visualization 2008 45/54
A lot of possible combinations A lot of possible combinations
Ding et al. 01, Shimony et al. 02, Zhang et al. 02, Brun et al. 03, Brun et al. 04, Corouge et al. 04, etc. There are a lot of similarity measures :
- Mean of closest points distance (Corouge et al. 04)
- Closest point distance (Corouge et al. 04)
- Hausdorff distance (Corouge et al. 04)
- End points distance (Brun et al. 03)
- ...
There are a lot of clustering algorithms:
- Hierarchical (Zhang et al. 02)
- Fuzzy c-means ( Shimony et al. 02)
- Spectral clustering (O’Donnell and Westin 05)
- Shared nearest neighbor (Moberts et al. 05)
- ...
Fi Fj
??
DTI Visualization Techniques and Applications IEEE Visualization 2008 46/54
Example Example: : Hierarchical Hierarchical Clustering Clustering
Weighted Average(HWA) Single Link (HSL) Complete Link (HCL)
{1,2,3,4,5} f3 f4 f5 f1 f2 {1,2} {3,4,5} {4,5}
Dendogram
5 n = 4 n = 3 n = 2 n =