
SLIDE 1
Different hydrologic impacts Di differently to warming respond very - - PowerPoint PPT Presentation
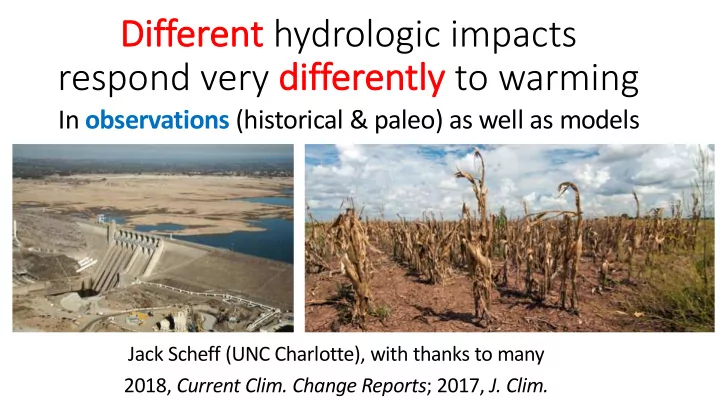
Different hydrologic impacts Di differently to warming respond very di In observations (historical & paleo) as well as models Jack Scheff (UNC Charlotte), with thanks to many 2018, Current Clim. Change Reports ; 2017, J. Clim. rcp8.5
familiar (Stippling = at least 80% of models agree on sign)
familiar “global drying” per ecologists (Stippling = at least 80% of models agree on sign)
familiar “global drying” per ecologists “global droughting”
d) PDSI = f(P,PET) change
(Stippling = at least 80% of models agree on sign)
familiar “global drying” per ecologists “global droughting”
d) PDSI = f(P,PET) change
global topsoil drying (Stippling = at least 80% of models agree on sign)
familiar “global drying” per ecologists “global droughting”
d) PDSI = f(P,PET) change
global topsoil drying (Stippling = at least 80% of models agree on sign)
familiar (Stippling = at least 80% of models agree on sign)
familiar runoff responses vary (Stippling = at least 80% of models agree on sign)
familiar runoff responses vary deep-soil responses vary (Stippling = at least 80% of models agree on sign) 3m soil moisture % change (from Berg et al 2017)
familiar runoff responses vary deep-soil responses vary (Stippling = at least 80% of models agree on sign) [LH/SH responses similar] 3m soil moisture % change (from Berg et al 2017)
familiar runoff responses vary deep-soil responses vary global greening! (Stippling = at least 80% of models agree on sign) [LH/SH responses similar] 3m soil moisture % change (from Berg et al 2017)
familiar runoff responses vary global greening! (Stippling = at least 80% of models agree on sign) “global droughting”
d) PDSI = f(P,PET) change
1%/yr exp with fert
1%/yr exp with fert 1%/yr exp nofert global greening is gone!
familiar runoff responses vary global greening! (Stippling = at least 80% of models agree on sign) “global droughting”
d) PDSI = f(P,PET) change
1951-2010 P trend (mm/yr per decade; IPCC 2013)
familiar (Stippling = trends are significant at 5%)
1951-2010 P trend (mm/yr per decade; IPCC 2013)
familiar (Stippling = trends are significant at 5%) severe “global droughting” 1950-2012 PDSI trend (PDSI per 50yr; Dai and Zhao 2016)
1951-2010 P trend (mm/yr per decade; IPCC 2013)
familiar (Stippling = trends are significant at 5%) severe “global droughting” 1950-2012 PDSI trend (PDSI per 50yr; Dai and Zhao 2016) runoff responses vary 1949-2012 runoff trend (0.1mm/day per 50yr; Dai and Zhao 2016)
1951-2010 P trend (mm/yr per decade; IPCC 2013)
familiar global greening from satellite! (Stippling = trends are significant at 5%) severe “global droughting” 1950-2012 PDSI trend (PDSI per 50yr; Dai and Zhao 2016) runoff responses vary 1949-2012 runoff trend (0.1mm/day per 50yr; Dai and Zhao 2016) 1982-2009 leaf area trend (0.1m2/m2 per decade; Zhu et al 2016)
familiar (Stippling = at least 80% of models agree on sign)
familiar (Stippling = at least 80% of models agree on sign) more “wetting”, except high lats.
d) PDSI = f(P,PET) change
familiar runoff responses vary (Stippling = at least 80% of models agree on sign) more “wetting”, except high lats.
d) PDSI = f(P,PET) change
familiar runoff responses vary global browning! (Stippling = at least 80% of models agree on sign) more “wetting”, except high lats.
d) PDSI = f(P,PET) change
Pollen (& macrofossil) data -> “Biomization” statistical approach: Prentice et al (1996), Clim. Dyn., methods Elenga et al (2000), J. Biogeogr., Africa & W. Europe Takahara et al (2000), J. Biogeogr., Japan Tarasov et al (2000), J. Biogeogr., Former Soviet & Mongolia Thompson and Anderson (2000), J. Biogeogr., Western US Williams et al (2000), J. Biogeogr., Eastern US Yu et al (2000), J. Biogeogr., China Harrison et al (2001), Nature, more China Bigelow et al (2003), JGR, pan-Arctic (>55N) Pickett et al (2004), J. Biogeogr., Australia to SE Asia Marchant et al (2009), Clim. Past, Latin America Mostly downloadable in Excel format
a) PDSI change with obs vegetation change −5 5 b) NPP change (kg C m−2 yr−1) with obs vegetation change −0.4 −0.2 0.2 0.4 0.6
−1
− − −
−
− − − −
a) PDSI change with obs vegetation change −5 5 b) NPP change (kg C m−2 yr−1) with obs vegetation change −0.4 −0.2 0.2 0.4 0.6
−1
− − −
−
− − − −
a) PDSI change with obs vegetation change −5 5 b) NPP change (kg C m−2 yr−1) with obs vegetation change −0.4 −0.2 0.2 0.4 0.6
−1
− − −
−
− − − −
Near-global browning at LGM, despite “less droughty conditions” but in line with model browning
a) PDSI change with obs vegetation change −5 5 b) NPP change (kg C m−2 yr−1) with obs vegetation change −0.4 −0.2 0.2 0.4 0.6
−1
− − −
−
− − − −
(i.e. near-global greening with warming, despite “drought” but in line with model greening)
Global Lake Status Data Base (direct LGM runoff proxies) (Harrison and Bartlein, 2012, in The Future of the World’s Climate)
−
− − − − − − − −
−
−0.02 − − − − − g) P−E change (mm day−1) −0.4 −0.2 0.2 0.4
− −
− −
Global Lake Status Data Base (direct LGM runoff proxies) (Harrison and Bartlein, 2012, in The Future of the World’s Climate)
−
− − − − − − − −
−
−0.02 − − − − − g) P−E change (mm day−1) −0.4 −0.2 0.2 0.4
− −
− −
Global Lake Status Data Base (direct LGM runoff proxies) (Harrison and Bartlein, 2012, in The Future of the World’s Climate)
real LGM runoff changes resembled model runoff projections (varied), not vegetation (browning)
familiar runoff responses vary global browning! (Stippling = at least 80% of models agree on sign) more “wetting”, except high lats.
d) PDSI = f(P,PET) change
familiar runoff responses vary global browning! (Stippling = at least 80% of models agree on sign) more “wetting”, except high lats.
d) PDSI = f(P,PET) change
1951-2010 P trend (mm/yr per decade; IPCC 2013)
familiar global greening from satellite! (Stippling = trends are significant at 5%) severe “global droughting” 1950-2012 PDSI trend (PDSI per 50yr; Dai and Zhao 2016) runoff responses vary 1949-2012 runoff trend (0.1mm/day per 50yr; Dai and Zhao 2016) 1982-2009 leaf area trend (0.1m2/m2 per decade; Zhu et al 2016)