
SLIDE 1
OAX: NOM
DFS Presentation
January 28, 2020
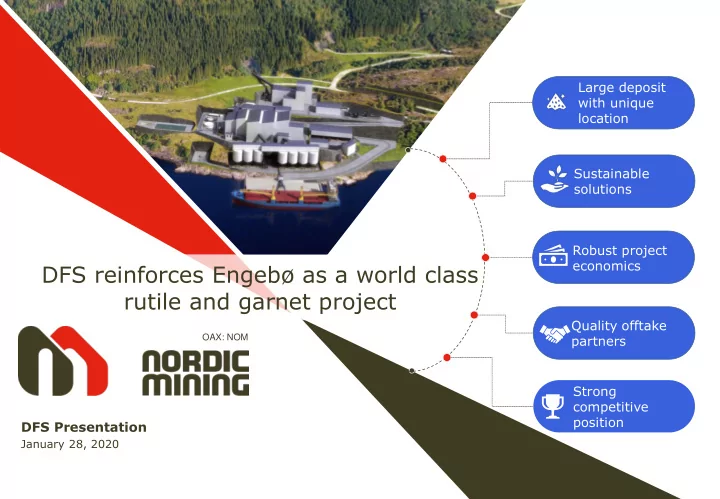
DFS reinforces Engeb as a world class rutile and garnet project - - PowerPoint PPT Presentation
Large deposit with unique location Sustainable solutions Robust project economics DFS reinforces Engeb as a world class rutile and garnet project Quality offtake partners OAX: NOM Strong competitive position DFS Presentation
OAX: NOM
January 28, 2020
2
3
Rutile
renewable energy storage Garnet
cutting and blasting material Alumina
production with integrated CO2 consumption
Keliber Oy Lithium (18.5%)
Engebø Rutile and Garnet (100%)
4
5
flourishment
respect and responsiveness
Nordic Mining will develop the Company’s Projects in accordance with IFC Performance Standards and the Equator Principles, and on the basis of the United Nation’s sustainable development goals
6
7
8
the region
9
surface
21,000m of core drilling
with high stability that offers efficient solutions
Ore reserves
10
Indicated resources represent 42 years project life
extension
Mineral resources (2% TiO2 cut-off)
Tonnes (mt) TiO2 grade (%) Garnet grade (%) Measured (M) 29.2 3.60 44.5 Indicated (I) 104.0 3.48 43.9 Total M&I 133.2 3.51 44.0 Inferred 254.1 3.15 41.3 Open pit Tonnes (mt) TiO2 grade (%) Garnet grade (%) Proven (P) 21.1 3.54 43.8 Probable (Pr) 13.2 3.29 43.3 Total P&Pr 34.3 3.45 43.6 Underground Proven (P) 2.4 3.34 39.2 Probable (Pr) 26.5 3.21 38.6 Total P&Pr 28.9 3.22 38.7
Source: JORC compliant Resource and Reserve statements by Competent Person Adam Wheeler
11
and process plant areas
Granted In progress
Detailed zoning plan
Open pit
12
resource utilization
Open pit – 15 years Underground – 19 years
Overview of open pit and underground Stockpile – 8 years
underground operations. Favorable geotechnical conditions allow for efficient and low cost mining with low carbon footprint
13
Open pit Total tonnes 53.1 Mt Ore to plant 22.9 Mt Ore to stockpile 11.3 Mt Waste rock 18.8 Mt Life 15 years Underground Total tonnes 30.3 Mt Ore to plant 28.8 Mt Waste rock 1.5 Mt Life 19 years Stockpile Total tonnes 11.3 Mt Ore to plant 11.3 Mt Life 8 years
0,0 0,5 1,0 1,5 2,0 2,5 3,0
2 4 6 8 10 12 14 16 18 20 22 24 26 28 30 32 34 36 38 40 42 44 46
Mtpa
Stockpile - Low Grade to Plant Stockpile - Medium Grade to Plant Stockpile - High Grade to Plant Underground - Ore to Plant Open Pit - Low Grade to Stockpile Open Pit - Medium Grade to Stockpile Open Pit - High Grade Mining Feed to plant
14
siloed ore storage
system allowing high degree of automation
downstream of crushing circuit
Key design factors Flowsheet
Operational staff Mining 31 Process 38 Service & maintenance 22 Sales, HR, Administration 14 Total 105
15
Garnet Rutile
Titanium Pigment Welding rods Sand blasting Waterjet cutting Abrasives
Market drivers
improves efficiency and reduces waste
aerospace industry Market drivers
health benefits in blasting
16
Global rutile supply development1 Global supply/demand balance until 2028
2021f 2013 2019f 2015 2023f 2017 2025f 2027f 2019f 2015 2013 2017 2025f 2021f 2023f 2027f
400 800 400 800
Note: 1) Supply profile only reflects existing operations Source: TZMI
‘000 TiO2 units ‘000 TiO2 units
Supply
rutile production from Australia and Africa
the only country with rutile production in Europe
feedstock expected to continue
planning will not replace estimated reduction of capacity Demand
Legend
Others India US Kenya China Sierra Leone CIS South Africa Australia Likely new supply Net supply Total demand
Legend
17
Source: TZMI
1 000 2 000
Rutile price forecast (nominal)
2005 2007 2011 2009 2017 2015 2019f 2021f 2023f 2025f 2027f 2013
Base case High case Low case
Price outlook
production, with some volatility from stocking and destocking cycles
2012, due to a de-stocking cycle, pushed rutile prices down
converge to long-term inducement price
price outlook
rutile (real 2019)
1,500 500 US$/tonne FOB
18
Garnet demand in waterjet cutting Garnet demand in abrasive blasting
Source: TZMI
‘000 tonnes ‘000 tonnes 4.9% 4.2%
2023f 2016 2027f 2013 2017 2014 2015 2018 2019f 2020f 2021f 2025f 2022f 2024f 2026f 2028f 2026f 2013 2014 2015 2016 2017 2018 2019f 2020f 2021f 2022f 2023f 2024f 2025f 2027f 2028f
800 400 400 800
China 19% Asia-Pacific ex China 18% North America 25% Europe 21% Middle East 16% Other 1%
Demand breakdown by region (2018) Key demand drivers
blasting and waterjet cutting
strengthen demand
lead demand growth in volume terms
19
Source: TZMI
Global average garnet price forecast (nominal) Price outlook
is of high quality and well suited for waterjet cutting
exhibited a clear upward trend since 2008
government ban on beach sand mining, has driven price appreciation
constraints in the medium term
garnet (average, real 2019)
US$/tonne FOB 100 400 300 200
2019f 2015 2017 2027f 2021f 2023f 2025f
Base case High case Low case
20
construction financing
The Barton Group
construction financing
production
the construction financing Japanese trading house
21
1) Average, first 15 years of production 2) Rutile and garnet combined 3) Net of royalties
22
241 284 292 299 292 314 318 321 395 373 370 366 446 403 396 388
220 260 300 340 380 420 460 Garnet revenue Rutile revenue Capex Opex
17% 17% 18% 19% 18% 18% 19% 19% 22% 21% 21% 20% 25% 23% 22% 21%
16% 17% 18% 19% 20% 21% 22% 23% 24% 25% Capex Garnet revenue Rutile revenue Opex
23
Net Present Value (post-tax) Internal Rate of Return (post-tax)
USD 344m 19.8%
most sensitive to positive changes in capex and changes in garnet revenue
in opex
sensitive to changes in garnet revenue
in opex
+/- 20% +/- 10% +/- 20% +/- 10%
Year
50 100 150
1 3 5 7 9 11 13 15 17 19 21 23 25 27 29 31 33 35 37 39 41 43 45 USDm Garnet revenue Rutile revenue Expansionary capex Delayed capex Opex Tax FCF - post tax Cumulative FCF - post tax
24 Source:
production after two years of construction
after year four
Initial capex
25
26
27
Strategic focus FEED
Civil works & underground Modules Process Mechanical installation Electrical installation Buildings Water and power supply Tentative construction sequence
28
procurement, construction and commissioning
mechanisms
Environmental and social management
Owner’s team
29
and leverage to be developed with the banks
debt Status of activities Sources of financing and guarantees
streaming, specialized funds)
Steps towards project financing Information to lenders Lenders due diligence Term sheet negotiations Credit approval Final debt agreements Equity raise
30
31
32
Kjell Roland, Chairman
ECON Analysis
Eva Kaijser, Board member
years in Boliden
Antony Beckmand, Board member
within the mining industry
experience across a range of commodities Ivar S. Fossum, CEO
and FMC Technologies Kenneth Nakken Angedal, Project Manager Engebø
management positions in the ABB Group Lars K. Grøndahl, Senior Advisor
Kjell Sletsjøe, Deputy Chairman
and construction industries as well as consulting
Birte Norheim, CFO
resources and infrastructure sector, i.a. as CEO of Njord Gas Infrastructure AS and VP Finance of Sevan Marine ASA Benedicte Nordang, Board member
positions from Equinor ASA and Aker Marine Contractors
Nussir ASA and Wega Mining ASA 33 Mona Schanche, VP Exploration
34
Assumptions first 15 years Unit Value Rutile price USD/t 1,142 Garnet price USD/t 246 Yearly average rutile sales ktpa 34 Yearly average garnet sales ktpa 278 Capex USDm 311 Open pit mining and comminution USDm 59 Mineral processing and tailings handling USDm 78 Infrastructure, storage and loadout USDm 103 Indirects (excluding contingency) USDm 50 Contingency USDm 21 Deferred capex underground mine USDm 25
35 Project financials Unit Value Pre-tax NPV @ 8% USDm 450 Pre-tax IRR % 21.9 Net Project operating cashflow (undiscounted) USDm 2,160 Post-tax NPV @ 8% USDm 344 Post-tax IRR % 19.8 Payback period Years 4.2 Production capacity Initial production capacity ROM Mtpa 1.5 Capital expenditure Initial capital expenditure for open pit and processing plant USDm 311 Deferred capital expenditure for underground mine USDm 25 Operating parameters first 15 years of commercial production Average operating cost 1, 2 USD/ROM tonne 15.44 Average operating cost 1, 2 USD/sales tonne 73.36 Average net operating revenue 1, 2, 3 USD/sales tonne 339.47 Mining and processing 4 Open pit phase Years 15 Total open pit production Mt 22.9 Underground phase Years 19 Total underground ore production Mt 28.8 Stockpile phase Years 8 Total stockpile ore production Mt 11.3 Total Project lifetime Years 42 Total Project ore production Mt 63.1 Average ore grade – Rutile 1 % 3.85 Average Rutile recovery 1 % 56.54 Average ore yield – Garnet 1 % 18.82 1) Average first 15 years 2) Rutile and Garnet combined 3) Net of royalties 4) 3 meters dilution applied on ore boundaries in the resource model