development cycle
play

Development cycle Climate change changing world contours Climate - PDF document

1. Agricultural situation Cereal system Initiative for South Asia 2. Climate change scenario 3. Agricultural options CONSERVATION AGRICULTURE a climate friendly approach 4. CSISA role & partnership Dr. M. Aqil Khan - Knowledge banks, -CKB


  1. 1. Agricultural situation Cereal system Initiative for South Asia 2. Climate change scenario 3. Agricultural options CONSERVATION AGRICULTURE – a climate friendly approach 4. CSISA role & partnership Dr. M. Aqil Khan - Knowledge banks, -CKB -HCP Country Coordinator IRRI-CIMMYT, Pakistan Development cycle Climate change changing world contours Climate change changing world contours o Population (�9b in 2050) o Industrialization o Agriculture and its input use o Globalization and market integration o Consumerism Resource base exploitation/deterioration
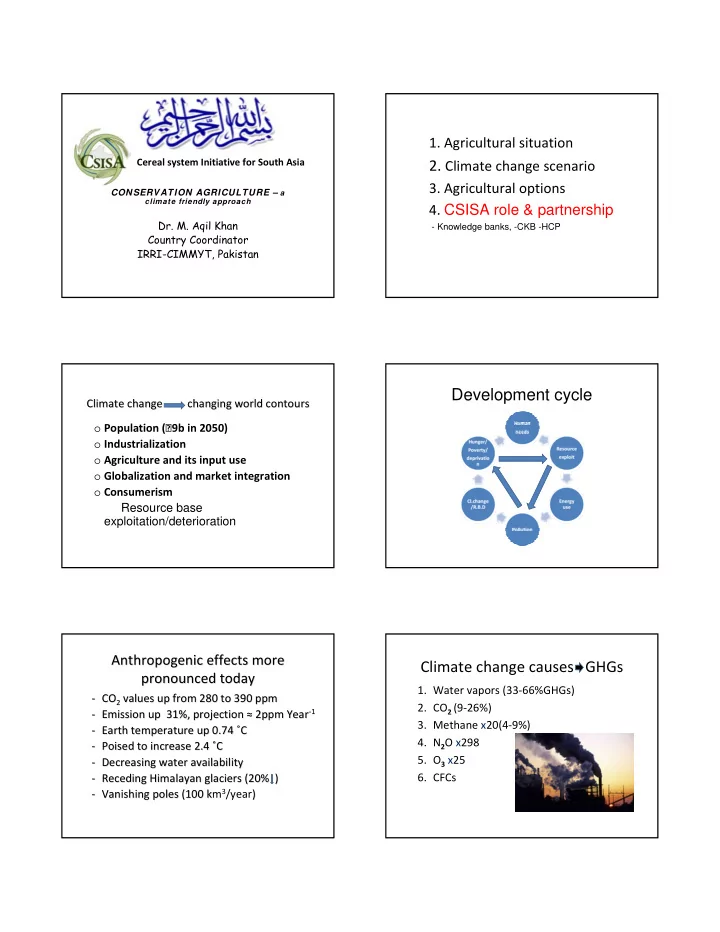
 Anthropogenic effects more Anthropogenic effects more Climate change causes GHGs pronounced today pronounced today 1. Water vapors (33 ‐ 66%GHGs) ‐ CO CO 2 values up from 280 to 390 ppm ‐ 2 values up from 280 to 390 ppm 2. CO 2 (9 ‐ 26%) ‐ 1 1 ‐ Emission up 31%, projection ‐ Emission up 31%, projection ≈ ≈ 2ppm Year 2ppm Year ‐ 3. Methane x20(4 ‐ 9%) ‐ Earth temperature up 0.74 ‐ Earth temperature up 0.74 ˚ ˚ C C 4. N 2 O x298 ‐ Poised to increase 2.4 Poised to increase 2.4 ˚ ˚ C C ‐ 5. O 3 x25 ‐ Decreasing water availability ‐ Decreasing water availability ‐ Receding Himalayan glaciers (20% ) Receding Himalayan glaciers (20% ) 6. CFCs ‐ Vanishing poles (100 km 3 /year) ‐ Vanishing poles (100 k ‐ )

  2. Increasing CO2 concentration in atmosphere Global anthropogenic carbon emission Carbon footprint of wheat crop in Pakistan Operation Fuel used (m.lit.) CO 2 prod. (m.tons) 2010 2020 2010 2020 Cultivation 484.64 530.4 1.31 1.43 Sowing 78.17 85.5 0.21 0.23 Herb. App. 27.45 30.0 0.08 0.08 Threshing 134 146.6 0.36 0.40 Total 724.3 792.6 1.96 2.14

  3. CO 2 and solar radiation Global temperature changes. Left: 1880-89. Right: 2000-09. NASA conducted the analysis using ship-based and satellite observations of sea-surface temperature, and data from Antarctic research stations and 6,300 meteorological stations around the world. Earth's average surface temperature has increased by about 0.7 °C (1.3 °F) since 1880. Two-thirds of the warming has occurred since 1975, at a rate of roughly 0.15 to 0.20 °C per decade. Credit: NASA GISS. Courtesy of the NASA Earth Observatory and Mike Carlowicz. “The frequency, and intensity of extreme events are expected to change as Earth’s climate changes.” (IPCC, 2007) How can crops adapt to: ● Heat waves? ● Delayed rains? ● Temporary flooding? ● Combinations of stresses? Challenge • At our current rate of consumption, human require equivalent of 1.4 planet to provide the resources we use and absorb our waste. As greenhouse gas emissions increase along with our rate of consumption, the situation will worsen. Reduce consumption we have one planet.

  4. Rising world population Population trends in Pakistan 10 300 267.8 Population (billions) Population (Millions) 9.1 250 8 211.4 200 7.7 6 137.5 150 6.1 108 5.3 100 4 50 2 0 1990 2000 2020 2050 0 Year 1990 2000 2020 2050 Year Demand for cereals will double by 2050 Dwindling land for agriculture 0.45 0.42 0.4 0.35 Rice 34% Wheat 23% h a P e r C a p ita 0.29 0.3 (149 M ha) (99 M ha) 0.24 0.25 0.2 0.18 Maize 21% 0.16 (94 M ha) 0.15 0.13 0.11 Potato 0.1 2% Millet Sorgum 8% 8% Cassava 0.05 4% Area sown to staples in 0 1961 1971 1981 1991 2001 2010 2020 developing countries Challenge to Food Security Production vs. Consumption Projected population and wheat requirement Mil. T. 700 *Wheat Area Area Total Population Required Yield Need released Production 600 Year (million) (m. ton) (t/ha) (000 ha) (000 ha) Total 500 Consumption 2010 173.5 22.90 2.6 9042 - 400 Human 2015 205.5 27.13 3.5 7750 1292 300 Animal 2020 226.2 29.86 4.0 7464 1578 200 Surplus 2025 246.3 32.51 4.3 7560 1482 100 0 2030 265.6 35.07 4.6 7624 1418 OThers 1990 1993 1996 1999 2002 2005 * Human needs+ 10 % seed and feed requirements

  5. Rising temperatures and crop production • Land reclassification by 2050 • 1 ˚ C rise would mean ≈ 7 % wheat yield loss • 1 ˚ C rise would mean ≈ 10% yield loss in rice • 44% yield loss in rainfed wheat yield • Significant pests, pathogen and weeds changes • Deleterious effects on grain quality and nutrients • 3 IPCC Climate Models • Increasing Heat Stress (wheat) • 17 ‐ 38% Reduction in High Potential Zone PER CAPI TA WATER AVAI LABI LI TY Per capita water availability VS POPULATI ON GROWTH m 3 /year/person, Pakistan 6000 250 Per Capita Water availability Population (In Millions) 5000 200 (In Cubic meter) 4000 150 3000 100 2000 50 1000 0 0 1951 1961 1972 1981 1992 2000 2003 2012 2020 Population Water Parameters/Years 1951 1961 1972 1981 1992 2000 2003 2012 2020 Water availability 5650 4000 2800 1900 1700 1400 1200 1000 885 Per Capita Population 33.7 42.8 65.3 84.2 132.0 140.0 149.0 176.0 216.8 Water scarcity level: 1700 CM /capita

  6. A disappearing Arctic ice cap Future scenario � Higher population • Challenges � Higher food demand 7.0 m sq km � Higher temperatures • Compulsions � Less water • Approaches � Scarce & costly inputs 4.9 m sq km - A skewed agricultural situation Present day agriculture would not be the answer to emerging situation Time, December 6, 2010 Translated into actionable propositions it means: New guiding philosophy • Increased food availability • Reduce cost of crop production More with less • Maintain momentum of growth Save as we grow • Promote biodiversity prosperity for all more production • Eliminate poverty more income • Conserve environment better health o Soil, water and air o Reduce energy use

  7. Solutions • Simple Achievable by: • Cheap Deployment of innovative • Effective combination of factors of production using CA platform Conservation Agriculture CA (climate smart agriculture) ‐ Resource saving crop production practices ‐ Integrates agri. technology with environment which aim at: management by promoting: • Sustainable high production • Crop rotation Promotes diverse and healthy produce • Crop/system profitability • Maintaining soil cover Reduces tilling/plowing, cost of • Natural forces enhancement • Minimum soil disturbance production and fuel consumption • Input optimization ‐ improves rain infiltration, reduces erosion and water requirement upto 30%, improves • Resource conservation drought tolerance Integrated Crop and Resource Management RC technologies “Ecological crop Intensification” ‐ Laser leveling Crop Management NRM ‐ Zero till Productivity with optimal CA based RCTS for efficient ‐ Bed planting external inputs use of natural resources ‐ DSR ‐ Controlled irrigation management in rice Cultivars Land leveling ‐ SSNM Fertilizer Tillage & crop est. ‐ Balanced /efficient fertilizer use Profitabl Pesticides Residue management e ‐ Residue management Labor Water incl. Rain Water cropping ‐ Increased cropping intensity/diversity Energy system Climate and soils ‐ New seed/cultivars Conservation agriculture

  8. RC technologies RC technologies/cont. Laser land leveling Increased cropping intensity (i.e. more crops per year) • • • Direct seeded rice • More cropping diversity (i.e. replacing existing crops with different crop types) Unpuddled transplanted rice New varieties of rice • • • Reduced tillage (i.e. strip tillage or fewer tillage passes) • New varieties of wheat • Zero tillage • Improved post ‐ harvest storage • Raised bed planting • Seed priming or treatment (fungicide, insecticide) • Increased application rates of fertilizer • Split applications of nitrogen • Decreased application rates of fertilizer • Banded fertilizer application • Application of micro ‐ nutrients • Deep placement of urea supergranules (USG) • Liming • Leaf color chart • Improved weed management • Nutrient Manager software • Increased irrigation frequency • GreenSeeker sensor • Decreased irrigation frequency • Brown manuring • Change in irrigation timing • Stale seedbed • AWD ‐ alternating wetting and drying Laser leveling – tabletop fields � Eliminates high/low points � Reduces irrigation times � Saves water ( ≈ 20 %) � Saves labor Water use (m3 /ha) in wheat under precision and traditional land leveling 0 ‐ til planting • No land preparation • Cost saving • Timely crop planting • Builds soil organic matter • Reduces compaction • Promotes biodiversity Effect of laser land leveling on water use (m3 /ha) in raised bed planted • Improves yield wheat • Environment friendly

  9. Haryana, India Indian Punjab Effect of Residues on Crop World ‐ wide adoption of Zero ‐ tillage 2008 Production Millions of hectares Total = 105.9 million ha. Data of K. Sayre from central Mexico Grain Yield (kg/ha) 8000 Canada 13.5 Kazakhstan 1.2 6000 USA 26.6 China 1.3 IGP 1.2 Ghana: 100.000 small 4000 farmers use NT Brazil 25.5 2000 W ‐ M, ZT, +Res. W ‐ M, ZT, ‐ Res. Paraguay 2.4 Australia M ‐ M, ZT, +Res. M ‐ M, ZT, ‐ Res. W ‐ M, CT, +Res. W ‐ M, CT, ‐ Res. 0 Argentina 19.7 12.0 1996 1997 1998 2000 2001 2002 Based on Derpsch and Friedrich, 2009 Bed planting • Water saving • Improves crop establishment • Reduces crop lodging • Reduces disease incidence • Improves yield • Crop establishment in saline/sodic soils

  10. Wheat in gypsum amended sodic soils DSR and AWD in rice DSR • Saves 75of planting cost • 30 % water Weed management a challenge • Reduce labor needs • Reduce energy needs • Optimal population AWD • Saves 30 % water Bed planted wheat ZTBP in operation ZT wheat ZT vs CP

Download Presentation
Download Policy: The content available on the website is offered to you 'AS IS' for your personal information and use only. It cannot be commercialized, licensed, or distributed on other websites without prior consent from the author. To download a presentation, simply click this link. If you encounter any difficulties during the download process, it's possible that the publisher has removed the file from their server.

Recommend


More recommend