SLIDE 1
Designing and implementing a model for Food Security in Zayed University
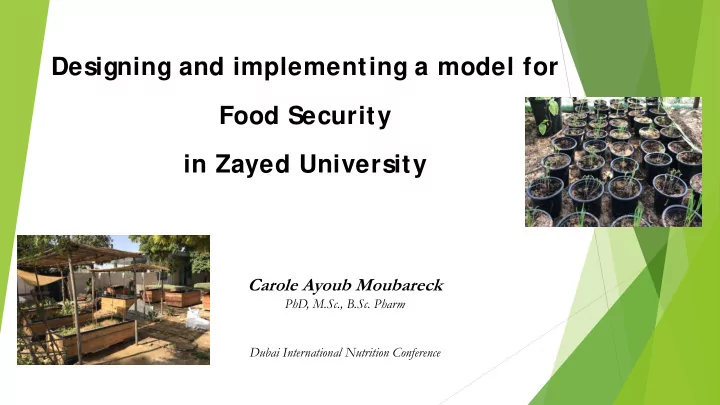
Carole Ayoub Moubareck
PhD, M.Sc., B.Sc. Pharm Dubai International Nutrition Conference
SLIDE 2
Create a food system that
is sustainable, fair, healthy
Recycle food waste Produce healthy vegetables and
fruits
We have a dream…
SLIDE 3
Human-centered
conceptual framework described as ME = WE
S
tudents become Leaders,
and “Change Makers” in
the field of food security.
We have a dream…
SLIDE 4
UAE Food S ecurity
Without relying on importations of the maj ority of food
supplies
Despite the multiple limitations
arable land scant rainfall extreme temperatures in the summer
SLIDE 5
UAE Food S ecurity
UAE population
Multicultural society with diverse eating preferences expected to reach 11.5 millions by 2025
Increase in tourism ➢ Overall rise in demand for food
SLIDE 6
2.7 kilograms of waste including food waste are generated daily per capita in the UAE and this increases to 4.5 kilograms during Ramadan.
Food Wastage in UAE – A Key Food S ecurity Challenge
UAE government goal is to recycle 75 per cent of food waste by 2021
SLIDE 7
KULNA means ALL OF US in Arabic. Led by a transdisciplinary team including students,
faculty, staff, community volunteers as well as local and international field experts at Zayed University
is a prototype model that addresses current
challenges related to food security, health, wellbeing and waste management in the UAE.
KULNA FOOD PRODUCTION S YS TEM
SLIDE 8
Model based on the principles of Permaculture – building
a permanent agriculture system that mimics a natural ecosystem in resilience and diversity.
Encourages people to be food producers rather than only
consumers.
KULNA FOOD PRODUCTION S YS TEM
SLIDE 9
Organic Food Production Creation of an enriched soil
KULNA FOOD PRODUCTION S YS TEM
SLIDE 10 Creation of an enriched soil
Organic FOOD WAS TE HEALTHY S
SLIDE 11
The COMPOS TING JOURNEY
SLIDE 12 Benefits of Composting
1.
Reducing Organic Food waste
2.
Reducing Greenhouse gases
3.
Replacing chemical fertilizers with
4.
Improving water holding capacity by retaining moisture in the soil
5.
Creating a sustainable food system
SLIDE 13
How did the students prepare Compost in 6 steps?
In a shady area of the
COMPOS T ALLEY , they placed a wooden composting box and have put a layer of small twigs and tree branches to aerate the preparation.
we can use plastic containers and put waste inside it, after making holes in all the sides to allow the air to go inside it.
SLIDE 14 How to prepare Compost in 6 steps?
Placed organic food waste inside the composting
bin.
S
pread soil
"already done" compost to incorporate decomposers (bacteria…) and st art the degradation. Addition
decomposers was not compulsory.
SLIDE 15 S
tudents adj usted the moisture in the compost pile. They added dry straw or sawdust to soggy materials
- r added water to compost piles that
were too dry.
S
tudents allowed the mixture to
"bake”. It heated up quickly and
reached the desired temperature (32° to 60° C). The pile settled down from its original height after four to five days.
SLIDE 16 The students added
brown materials once a week.
They mixed the compost
to allow air to come inside it and speed up the process.
SLIDE 17
After 3 months, the
compost looked like dark crumbly soil mixed with small pieces of organic material.
It had a sweet and
earthy smell.
SLIDE 18
Composting parameters
C:N ratio the brown and green materials have to be added in the ratio of 3:1 to obtain a compost of good quality. Carbon (brown materials) is an energy source for microorganisms. Nitrogen (green materials) component of nucleic acids, proteins, enzymes and coenzymes.
SLIDE 19 The green ingredients used in compost
Bananas Parsley Potatoes Carrots Egg plants Apples Watermelon Grass clipping Flower Etc…
SLIDE 20
The brown ingredients used in compost
Brown leaves Newspapers Wood chips S
traw
SLIDE 21
The ingredients that are not supposed to be in compost
Garlic, onions or spicy peppers Citrus fruits: lemons, oranges, or their peels Diseased plants Cooking oil Meat or dairy products
SLIDE 22
Activators can be used to speed up the process
Nitrogen rich ingredients Alfalfa meal Soil microorganisms, blend of
microorganisms that contains bacteria and fungi etc… to speed up the process.
SLIDE 23 The decomposition is performed by micro-
- rganisms, mostly bacteria, but also yeasts and
fungi. In low temperature phases a number of macro-
- rganisms, such as springtails, ants, nematodes,
isopods and earthworms also contribute to the process, as well as soldier flies, fruit flies and lezards.
WHO are the decomposers?
SLIDE 24
Twelve different compost samples were prepared over a
period of 3 months.
The compost samples had the fresh smell of the
forest.
SLIDE 25
S tandard range is between 30 to 70%
All 12 samples organic matter between 38 to 50%
10 20 30 40 50 60 1 2 3 4 5 6 7 8 9 10 11 12 % Sample Number
ORGANIC MATTER %
Analysis of the physico-chemical properties
SLIDE 26
Typical mature compost moisture content should be between 40-50%
S ample 3 and 11 were within the range
S ample 5 and 12 were above the range
Remaining eight samples were below the range
Low moisture content may be due to the mixing of samples with sand
10 20 30 40 50 60 70 80 1 2 3 4 5 6 7 8 9 10 11 12 % Sample Number
MOISTURE %
SLIDE 27 pH is an indicator of the presence
- f organic acid intermediates that
smell bad.
S
tandard range for the pH of the compost should be between 6 to 8
pH of all the samples were within
the range except for the sample 1 which was 8.5
This slight basic pH is acceptable
7.2 7.4 7.6 7.8 8.0 8.2 8.4 8.6 1 2 3 4 5 6 7 8 9 10 11 12 Sample Number
pH
SLIDE 28 Electrical Conductivity (EC)
S
alts (EC) are mineral ions that are naturally present in compost
standard range for EC in compost ranges from 1–10 mS / cm
All our samples were within the range and had values between 1 to 5.1 mS / cm
1 2 3 4 5 6 1 2 3 4 5 6 7 8 9 10 11 12 Sample Number
SLIDE 29 Macronutrients in the compost
S tandard range of the nitrogen in the finished compost ranges between 0.5 to 2.5% .
Available Nitrogen in the compost is LOW ranging from 0.02 to 0.15%
This indicates that our compost still needs maturation.
0.00 0.02 0.04 0.06 0.08 0.10 0.12 0.14 0.16 1 2 3 4 5 6 7 8 9 10 11 12 % Sample Number
NITROGEN %
SLIDE 30
Excess sodium can lead to sodicity, which is the ability of sodium to disperse soil particles so that soil structure is lost.
Compost containing more than 1% sodium is considered to be quite high in sodium.
All our samples were below 1% with percentages ranging between 0.11 to 0.45%
0.00 0.05 0.10 0.15 0.20 0.25 0.30 0.35 0.40 0.45 0.50 1 2 3 4 5 6 7 8 9 10 11 12 % Sample Number
SODIUM %
SLIDE 31 Potassium and Phosphorus
Phosphorous and potassium are the essential nutrients for the plants.
The amount required for the different plants are not yet standardized but their availability in the compost is beneficial.
Potassium found in amount between 0.32 to 0.95%
.
Phosphorus found between 0.05 mg/ kg and 0.31 mg/ kg.
SLIDE 32 S tudy of the microbial diversity
Fluorescent in sit u hybridization technique
SLIDE 33 Oligonucleotide probes used in this study
Probe name Target organism
Rank
HGC69a Actinobacteria
Phylum
Bet42a Betaproteobacteria
Class
Gam42a Gammaproteobacteria
Class
ARC915 Archaea
Domain
NSO190 Beta-proteobacterial ammonia-
Class
NIT3 Nitrobacter species
Genus
NEU Most halophilic and halotolerant nitrosomonas species.
Genus
NSR1156 Nitrospira moscoviensis, freshwater Nitrospira species
Species, Genus
SLIDE 34 5 10 15 20 25 30 35 40 Actinobacteria Bet aproteobacteria Gammaproteobacteria Archaea Bet aproteobacterial ammonia oxidizing bacteria Nitrobacter species Halophilic and halotolerant nitrosomonas species Nitrospira species Average %
MICROBIAL DIVERSITY
SLIDE 35 Actinobacteria
Gram positive bacteria found
dominant
Production of extracellular enzymes
and bioactive metabolites which play a crucial role in the degradation of complex substrates such as lignocellulose.
5 10 15 20 25 30 35 40 Average %
MICROBIAL DIVERSITY
27 %
SLIDE 36 Proteobacteria
Gram negative bacteria Role in the degradation of
glucose, propionate and butyrate.
Role in the oxidation of
ammonia.
5 10 15 20 25 30 35 40 Average %
MICROBIAL DIVERSITY
17.8% 16.7% 21.8%
SLIDE 37 Archaea
help in the nitrification
process and in the oxidation
Nitrospira species
important for nitrite
Nitrobacter species
help in the oxidation of
nitrite.
Nitrosomonas species
Help in the household waste
composting process.
5 10 15 20 25 30 35 40 Average %
MICROBIAL DIVERSITY
8.5% 12.4% 9.5% 9.4%
SLIDE 38 S ummary of the compost analysis
Compost of GOOD QUALITY
Organic matter, EC and pH parameters met the standards. S
- dium, Potassium, Phosphorus adequate concentrations
Moisture and total nitrogen were detected at low levels.
The low availability of nitrogen is strongly related to the immaturity of the compost.
Microbial identification revealed the presence of actinobacteria,
various proteobacteria, archaea and different nitrifying bacteria which facilitate the decomposition process.
SLIDE 39 Zayed University Compost was used:
tarter for composting at home
- Growth of indoors plants
- To cultivate vegetables outdoors
- To enrich the soil of the Kulna Food
Production S ystem
SLIDE 40
Wit h t he Compost Proj ect , we encouraged t he KULNA Food Product ion S yst em. By mult iplying similar syst ems in t he UAE, we will go from a net import ing nat ion t o a sust ainable communit y of empowered individuals.
SLIDE 41
Acknowledgements
SLIDE 42 Questions / Comments
Carole Ayoub Moubareck Associate Professor, College of Natural and Health Sciences, Zayed University Tel: 04 402 1745 carole.ayoubmoubareck@zu.ac.ae
For more information, please check www.kulna.me