
SLIDE 1
Alexander J. Stein October 1, 2013 www.AJStein.de 1
Measuring food and nutrition security based on health outcomes
Conference on Global Food Security October 1, 2013, Noordwijkerhout
Alexander J. Stein
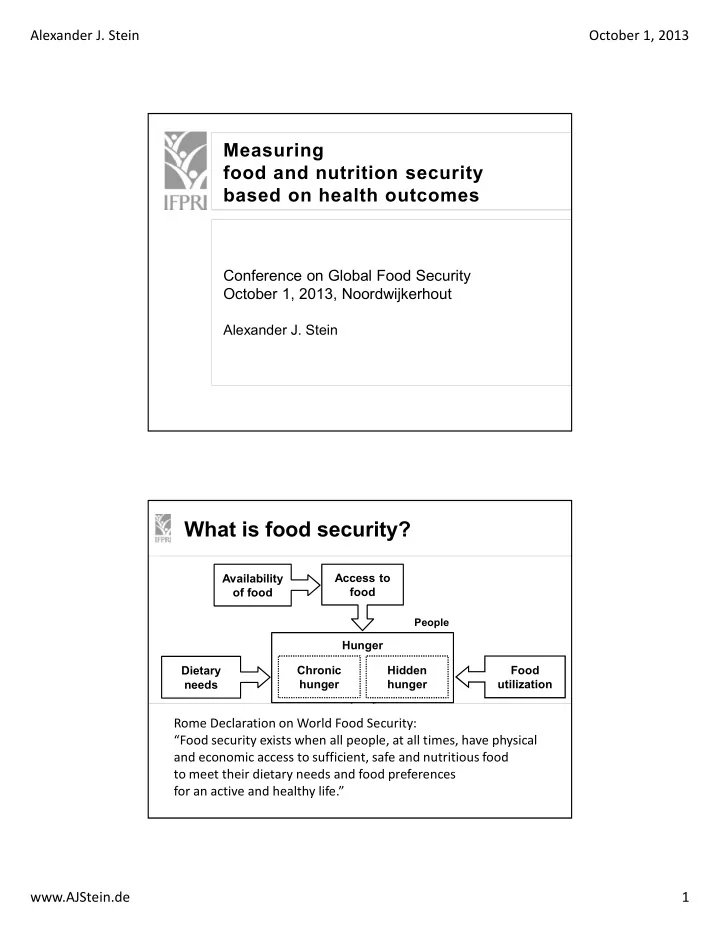
What is food security?
Dietary needs Food utilization Hunger Chronic hunger Hidden hunger Access to food Availability
- f food