
SLIDE 1
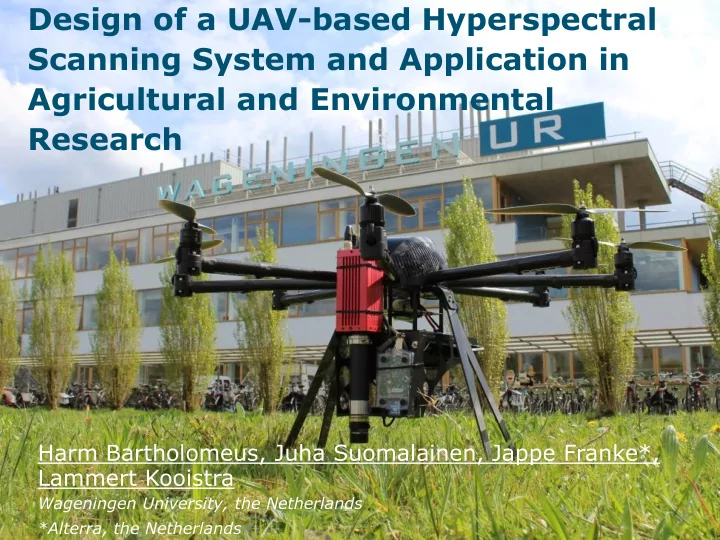
Design of a UAV-based Hyperspectral Scanning System and Application in Agricultural and Environmental Research
Harm Bartholomeus, Juha Suomalainen, Jappe Franke*, Lammert Kooistra
Wageningen University, the Netherlands *Alterra, the Netherlands