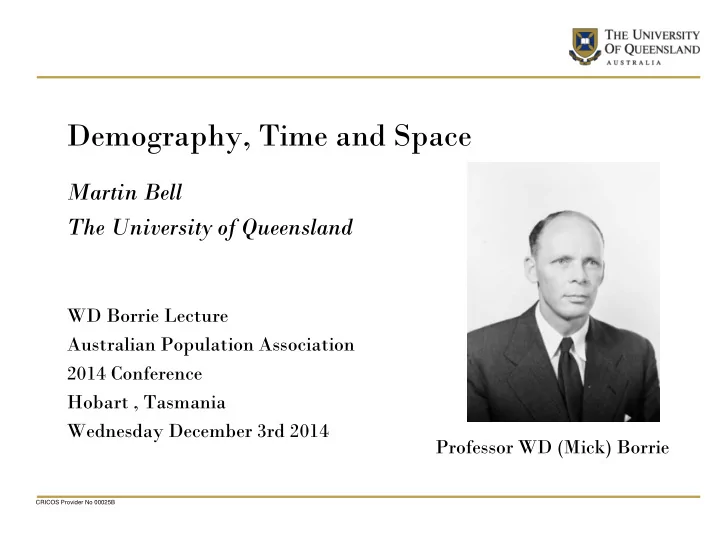

Demography, Time and Space Martin Bell The University of Queensland WD Borrie Lecture Australian Population Association 2014 Conference Hobart , Tasmania Wednesday December 3rd 2014 Professor WD (Mick) Borrie CRICOS Provider No 00025B
Demography Definition: The scientific study of population, with a central focus on the size, distribution and composition of population, and the processes of population change. Essence of a discipline: • Substantive focus • Theoretical constructs • Analytical methods • Data sources • Core problems
Fissiparous (!) https://www.google.com.au/#q=fissiparous CRICOS Provider No 00025B
End of the Demographic Transition? Source: van Dalen and Henkens 2012 DOI: 10.4054/DemRes.2012.26.16 /
• Demography and Time
Demographic Transition Theory “… the central preoccupation of modern demography.” Caldwell 1996
Lexis Diagrams Age Age-Time plan depicting the relationship between age, Period-Age period and birth cohort. a+3 Age and time divided into equal intervals Lifelines show individual aging Events fall into age time intervals a+2 Links population stocks and flows Period-Age Framework for the assembly and analysis of demographic a+1 Period- Cohort data Time a,t t+1 t+2 t+3
Age at Migration & Life Course Events 30.0 25.0 20.0 15.0 10.0 5.0 0.0 Age at Education Labour Union First child, peak completion, force entry, formation, women migration women men men Source: Bernard, A., Bell, M. and Charles-Edwards, E. [2014]: Life-course transitions and the age profile of internal migration, Population and Development Review, 40(2): 213-239
• Demography and Space
John Snow and the Soho cholera epidemic http://upload.wikimedia.org/wikipedia/commons/c/cc/John_Snow.jpg http://upload.wikimedia.org/wikipedia/c http://uuushh.files.wordpress.com/2011/04/on-the-mode-of-communication-of-cholera_john-snow_1855.jpg ommons/c/cb/John_Snow_memorial_a http://www.darpa.mil/uploadedImages/Content/NewsEvents/Releases/2014/London1854CholeraMapAlteredImage.jpg nd_pub.jpg
The European Fertility Project Source: Woods, R. (1979): Population Analysis in Geography, Longman
Problems with Spatial Aggregates Ecological Fallacy: • Making inferences about processes at the level of individuals from analysis of data about the groups to which they belong MAUP – Modifiable Areal Unit Problem: • Aggregated values vary according to (a) the number of units into which a region is divided (scale effect) and (b) the way the boundaries are drawn (pattern effect)
Four Domains of Spatial Demography 1. Spatial differentiation • GWR, Spatial clustering, Moran’s ‘I’ 2. Modelling spatial diffusion • Event history, Multi-level regression 3. Location/allocation modelling • Thiessen polygons, SIMs 4. Areal estimation • Remote sensing, areal interpolation
Estimating Population Population Distribution; Cyprus Population Density India Source: Landscan Source: CIESEN/GRUMP http://web.ornl.gov/sci/landscan/images/cyprus2011.png http://sedac.ciesin.columbia.edu/maps/gallery
Gridded Population Data 100m 2 Benin West Africa Source: Worldpop.org.uk http://www.worldpop.org.uk/ebola/ CRICOS Provider No 00025B
Example of aggregation: Germany 412 BSUs 200 ASRs 150 ASRs 100 ASRs 50 ASRs 10 ASRs CRICOS Provider No 00025B
The MAUP and the MEI Source: The IMAGE Project: see http://www.gpem.uq.edu.au/image
Comparing Migration Effectiveness Source: The IMAGE Project: see http://www.gpem.uq.edu.au/image
• Space-time convergence
Global Migration Intensities 54.7 Iceland 19.1 New Zealand South Korea 52.8 17.6 Australia USA 44.3 Finland 17.0 Australia 42.4 Zambia 16.0 Fiji 41.3 Canada 38.5 Kenya 15.4 Panama 37.1 Canada 13.3 Chile 36.2 Norway 12.8 Switzerland 36.1 Senegal 34.7 Sweden 12.7 France 34.0 USA 12.5 Cameroon 32.9 Denmark 12.2 Paraguay 31.0 Japan 28.9 12.0 Tanzania Israel 28.2 10.9 UK Mongolia 27.4 10.7 Barbados 26.5 One year intensities Switzerland Bolivia 22.9 10.3 Belgium Fiver year intensities Kyrgyzstan 22.4 Netherlands 10.1 Peru 21.8 21.5 Germany 9.0 Uruguay 21.3 Guinea Sudan 8.8 21.2 South Africa Colombia 8.6 Morocco 20.8 Greece 8.1 Malta 19.8 Uganda 19.1 Austria 8.1 Cambodia 18.4 Japan 7.9 Rwanda 18.1 Hungary 7.4 Greece 18.1 Brazil 17.5 7.1 Turkey Argentina 17.5 7.0 Israel Malaysia 17.1 6.6 Costa Rica 16.7 Ireland Tunisia 15.9 Belarus 5.7 Ghana 15.0 Lithuania 5.5 Guatemala 14.4 Dominican Republic 13.9 Latvia 5.1 Portugal 13.5 Italy 5.1 China 12.8 Portugal 5.1 Vietnam 12.6 Indonesia 12.4 Estonia 4.8 El Salvador 12.3 Malta 4.7 12.0 Mauritius Bulgaria 4.5 11.9 Cuba 11.9 Czech Republic 4.2 Honduras Thailand 11.2 Burkina Faso 4.0 St Lucia 10.9 4.0 Romania Nicaragua 10.1 3.8 Ecuador 9.6 Cyprus Haiti 9.5 Spain 3.1 Philippines 9.3 Slovakia 2.7 Spain 8.6 Iraq 8.5 Croatia 2.7 Nepal 8.3 Ukraine 2.7 Venezuela 7.8 Slovenia 2.5 Mali 7.4 North Korea 6.3 Russian Federation 2.0 Mexico 6.1 Poland 1.3 Egypt 5.4 Macedonia 1.0 India 5.2 0.0 5.0 10.0 15.0 20.0 0.0 20.0 40.0 60.0 ACMI (%) ACMI (%) CRICOS Provider No 00025B Source: The IMAGE Project: See Bell, M, Charles-Edwards, E, Ueffing, P., Stillwell, J., Kupiszewski, M. and Kupiszewska, D. [forthcoming]: Internal migration and development: comparing migration intensities around the world, http://www.gpem.uq.edu.au/image
Mobility in Space and Time Spatial Boundaries Local Regional National Residential Intra-urban Inter-regional Inter- mobility Rural-urban Inter-urban Years national Urban-rural 12 months Seasonal work Months Extended recreational travel Time 4 weeks Vacations Study Weeks Long distance commuting 7 days Business travel Health care Days Excursions 24 hours Visits Commuting Hours Shoppin g community Region Local Nation World Space
• Coupling Space and Time – Mobility and Migration
Tracking Mobility in West Africa Mobile Phone Flowmaps Source: http://www.worldpop.org.uk/ebola / CRICOS Provider No 00025B
Tracking Tourists in Noosa See Charles-Edwards, E., Bell, M. & Corcoran, J. [2014]: Integrating undergraduate fieldwork into the study of human mobility, Australian Geographer , 45(4): 505-519 DOI:10.1080/00049182.2014.953734
Tracking the St Lucia Campus Population See: Charles-Edwards, E. and Bell, M. [2013]: ‘Estimating the service population of a large metropolitan university campus’, Applied Spatial Analysis and Policy, 6(3): 209-228 DOI 10.1007/s12061-012-9079-y
Space-Timelines : Daily Activity Patterns CRICOS Provider No 00025B Source: Parkes and Thrift (1980) : Times, Spaces, and Places: A Chronogeographic Perspective, Wiley, New York
Capturing Life-Spaces Defining Life Spaces Source: Lelievre & Robette 2010 Source: Hagerstrand Figure 11 in Carlstein, Parkes and Lelievre, E. and Robette, N (2010) A Life Space Perspective Thrift (1978) : Timing Space and Spacing Time to Approach Individual Demographic Processes, Canadian Studies in Population, Vol. 37.1-2: 207-244 CRICOS Provider No 00025B
Demography, Space & Time • Conclusions
Recommend
More recommend