SLIDE 1
Demography of First Time College Students
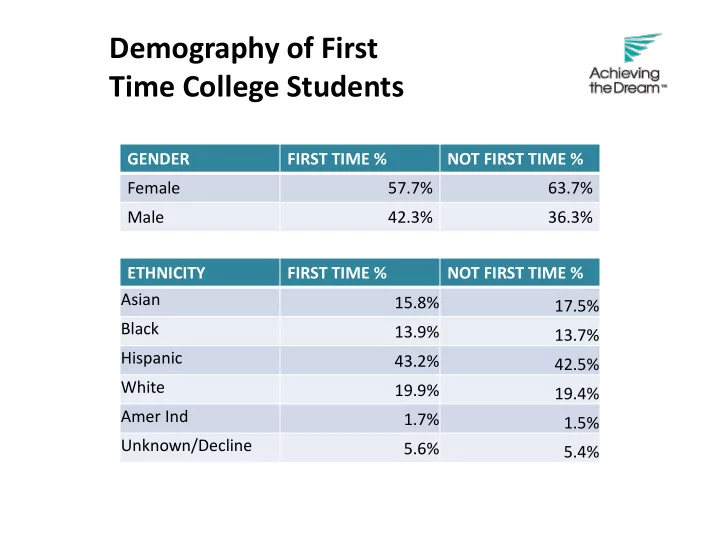
Gender GENDER FIRST TIME % NOT FIRST TIME % Female 57.7% 63.7% Male 42.3% 36.3% ETHNICITY FIRST TIME % NOT FIRST TIME % Asian 15.8% 17.5% Black 13.9% 13.7% Hispanic 43.2% 42.5% White 19.9% 19.4% Amer Ind 1.7% 1.5% Unknown/Decline 5.6% 5.4%
SLIDE 2
Demography of First Time College Students
Gender FINANCIAL AID FIRST TIME % NOT FIRST TIME % NO BOGG 63.9% 67.4% BOGG 36.1% 32.6% AGE FIRST TIME % NOT FIRST TIME % Under 20 54.6% 23.4% 20 - 24 21.4% 33.0% 25 - 34 13.7% 22.9% 35 - 54 9.3% 17.6% 55 and over .9% 3.1%
SLIDE 3 Demography of First Time College Students Summary
GENDER A slight difference compared to the college population. Slightly less (6%) first time college student women and 6% more men. ETHNICITY Overall, ethnicity of first time college students mirror the rest
- f the college population.
FINANCIAL AID A little over 36% receive some kind of financial assistance. AGE Most first time college students are recent high school
- graduates. This results to a
largely younger population compared to the entire college population.
SLIDE 4 44.1% 25.5% 47.0% 30.3% 53.6% 41.5% 53.0% 42.6%
0% 20% 40% 60% 80% 100%
Fa04 Sp05 Fa05
Asian F Asian M AfrAmer F AfrAmer M Hisp F Hisp M White F White M
Persistence of First Time College Students By Ethnicity and Gender (Slide 1)
Lowest Persistence In The First Year: African American Male African American Female Hispanic Male White Male
SLIDE 5 22.5% 27.5% 19.7% 12.1% 34.3% 26.6% 36.5% 27.8%
0% 20% 40% 60% 80% 100%
Fa04 Sp06 Fa06
Asian F Asian M AfrAmer F AfrAmer M Hisp F Hisp M White F White M
Persistence of First Time College Students By Ethnicity and Gender (Slide 2)
Lowest Persistence In The Second Year: African American Male African American Female Hispanic Male White Male
SLIDE 6 13.7% 11.8% 12.1% 7.6% 18.8% 15.9% 21.7% 11.3%
0% 20% 40% 60% 80% 100%
Fa04 Sp07 Fa07
Asian F Asian M AfrAmer F AfrAmer M Hisp F Hisp M White F White M
Persistence of First Time College Students By Ethnicity and Gender (Slide 3)
Lowest Persistence In The Third Year: African American Male African American Female Hispanic Male White Male
SLIDE 7 8.8% 9.8% 6.9% 1.5% 7.6% 13.0% 11.3% 7.8%
0% 20% 40% 60% 80% 100%
Fa04 Sp08 Fa08
Asian F Asian M AfrAmer F AfrAmer M Hisp F Hisp M White F White M
Persistence of First Time College Students By Ethnicity and Gender (Slide 4)
Lowest Persistence In The Fourth Year: African American Male African American Female Hispanic Male White Male Asian Male
SLIDE 8 10.0% 6.3% 5.9% 6.1% 0.0% 8.8% 7.0% 7.0%
0% 20% 40% 60% 80% 100%
Fa04 Sp09 Fa09
Asian F Asian M AfrAmer F AfrAmer M Hisp F Hisp M White F White M
Persistence of First Time College Students By Ethnicity and Gender (Slide 5)
Lowest Persistence In The Fifth Year: African American Male African American Female Hispanic Male White Male Asian Male White Female
SLIDE 9
Persistence of First Time College Students Summary
Ethnicity and Gender With Lowest Persistence In 5-Years:
African American Males African American Females Hispanic Males White Males
SLIDE 10
Degree and Certificate Attainment of First Time College Students Over Time
7 39 65 36 20 19 7
Within 1 year 2 years 3 years 4 years 5 years 6 years More than 6 years
Count
SLIDE 11
Degree and Certificate Attainment of First Time College Students Summary Awards Received:
Within 2 years -- 4% received a degree or certificate. Within 4 years –12% received a degree or certificate. Overall, 16% (or 193) of 1,209 First Time College Students in Fall 2004 received a degree or certificate.
SLIDE 12
English, Math, and PD Courses Taken & Successfully Completed Within the First Year of College
32% (390) took an English course. Of that group, 6% were African American, 17% Asian, 21% White, and 49% Hispanic. 19% (225) took a Math course. Of that group, 5% were African American, 15% Asian, 20% White, and 53% Hispanic. Only 2% took a Personal Development course.