
SLIDE 1
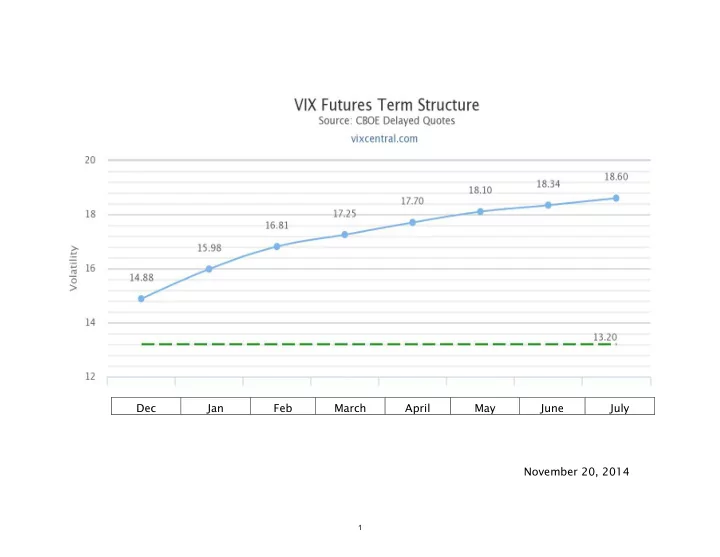
Dec Jan Feb March April May June July November 20, 2014
1
Dec Jan Feb March April May June July November 20, 2014 1 VIX - - PowerPoint PPT Presentation
Dec Jan Feb March April May June July November 20, 2014 1 VIX Futures Historical Prices August 1, 2011 August 8, 2011 40 35 30 Volatility 25 20 15 0 30 60 90 120 150 180 210 Days to
1
2
Credit Suisse
3
4