
SLIDE 1
4.2018
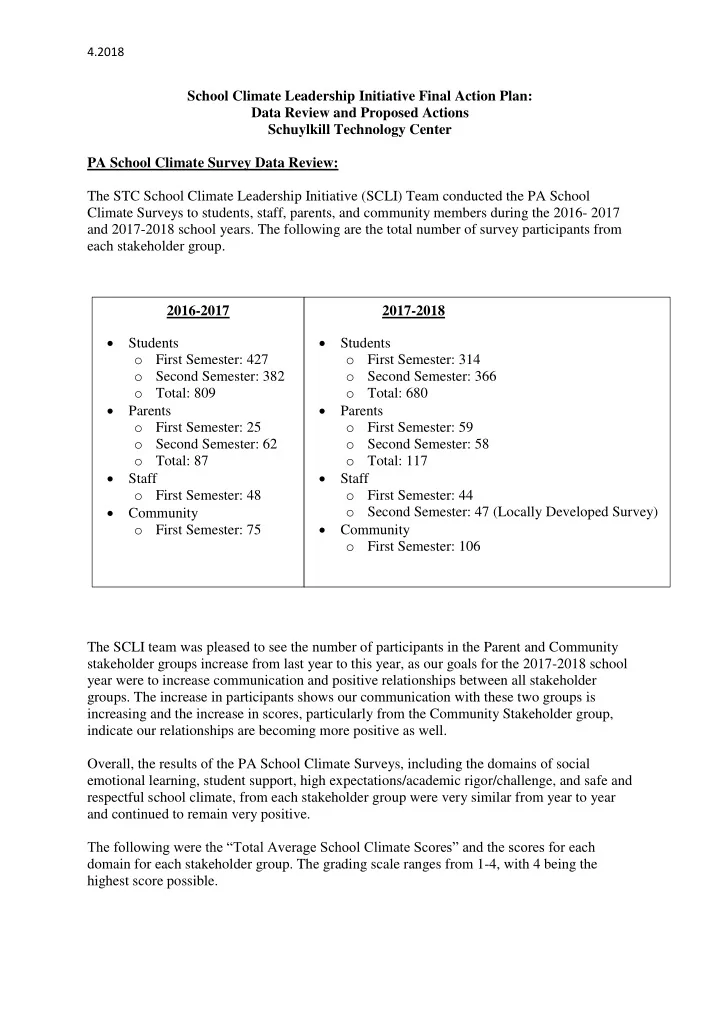
School Climate Leadership Initiative Final Action Plan: Data Review and Proposed Actions Schuylkill Technology Center PA School Climate Survey Data Review: The STC School Climate Leadership Initiative (SCLI) Team conducted the PA School Climate Surveys to students, staff, parents, and community members during the 2016- 2017 and 2017-2018 school years. The following are the total number of survey participants from each stakeholder group. The SCLI team was pleased to see the number of participants in the Parent and Community stakeholder groups increase from last year to this year, as our goals for the 2017-2018 school year were to increase communication and positive relationships between all stakeholder
- groups. The increase in participants shows our communication with these two groups is
increasing and the increase in scores, particularly from the Community Stakeholder group, indicate our relationships are becoming more positive as well. Overall, the results of the PA School Climate Surveys, including the domains of social emotional learning, student support, high expectations/academic rigor/challenge, and safe and respectful school climate, from each stakeholder group were very similar from year to year and continued to remain very positive. The following were the “Total Average School Climate Scores” and the scores for each domain for each stakeholder group. The grading scale ranges from 1-4, with 4 being the highest score possible. 2016-2017 Students
- First Semester: 427
- Second Semester: 382
- Total: 809
Parents
- First Semester: 25
- Second Semester: 62
- Total: 87
Staff
- First Semester: 48
Community
- First Semester: 75
2017-2018 Students
- First Semester: 314
- Second Semester: 366
- Total: 680
Parents
- First Semester: 59
- Second Semester: 58
- Total: 117
Staff
- First Semester: 44
- Second Semester: 47 (Locally Developed Survey)
Community
- First Semester: 106