Schuylkill Yards Philadelphia PENNSYLVANIA Schuylkill Yards - - PDF document

schuylkill yards
SMART_READER_LITE
LIVE PREVIEW

Schuylkill Yards Philadelphia PENNSYLVANIA Schuylkill Yards - - PDF document

Investor Update February 28, 2017 Building the Future 4 th 2 0 1 6 Q U A R T E R Our Commitment to Shareholder Value, Our Communities and the Environment Our deep commitment to shareholder value, our communities and the environment have


slide-1
SLIDE 1

Company Profile

Brandywine Realty Trust is one of the largest, publicly traded (NYSE:BDN), full-service, integrated real estate companies in the United States with a core focus in the Philadelphia, Washington, D.C., and Austin markets. Organized as a real estate investment trust (REIT) we own, develop, lease and manage an urban, town center and transit-oriented portfolio comprising 210 properties and 27.6 million square feet as of December 31, 2016.
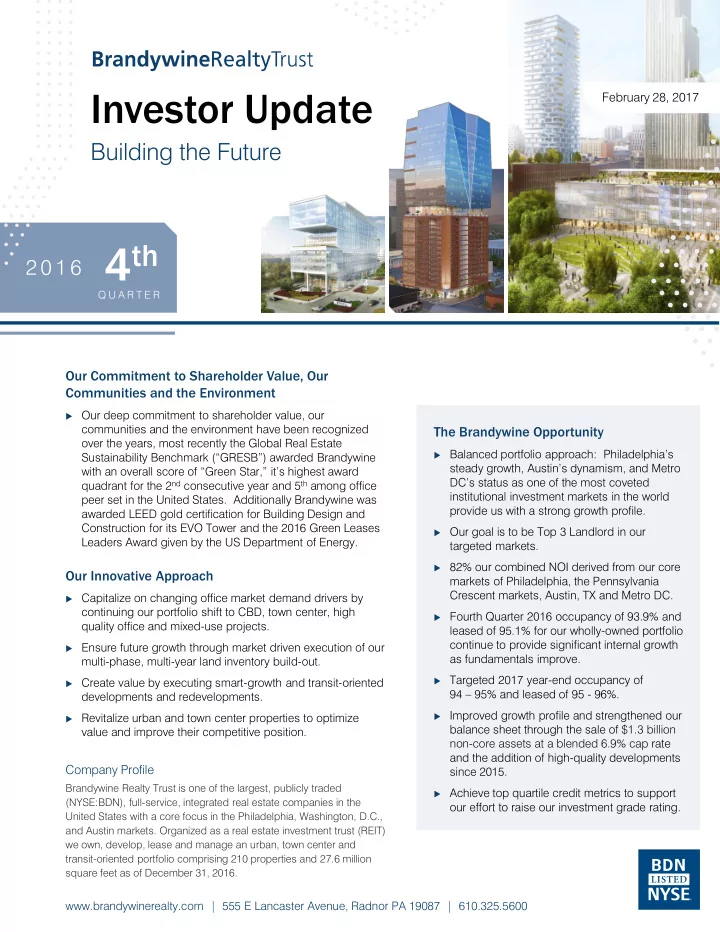
Investor Update

www.brandywinerealty.com | 555 E Lancaster Avenue, Radnor PA 19087 | 610.325.5600

4th

2 0 1 6

Q U A R T E R

Building the Future

Our Commitment to Shareholder Value, Our Communities and the Environment

 Our deep commitment to shareholder value, our

communities and the environment have been recognized

  • ver the years, most recently the Global Real Estate

Sustainability Benchmark (“GRESB”) awarded Brandywine with an overall score of “Green Star,” it’s highest award quadrant for the 2nd consecutive year and 5th among office peer set in the United States. Additionally Brandywine was awarded LEED gold certification for Building Design and Construction for its EVO Tower and the 2016 Green Leases Leaders Award given by the US Department of Energy.

Our Innovative Approach

 Capitalize on changing office market demand drivers by

continuing our portfolio shift to CBD, town center, high quality office and mixed-use projects.

 Ensure future growth through market driven execution of our

multi-phase, multi-year land inventory build-out.

 Create value by executing smart-growth and transit-oriented

developments and redevelopments.

 Revitalize urban and town center properties to optimize

value and improve their competitive position.

The Brandywine Opportunity

 Balanced portfolio approach: Philadelphia’s

steady growth, Austin’s dynamism, and Metro DC’s status as one of the most coveted institutional investment markets in the world provide us with a strong growth profile.

 Our goal is to be Top 3 Landlord in our

targeted markets.

 82% our combined NOI derived from our core

markets of Philadelphia, the Pennsylvania Crescent markets, Austin, TX and Metro DC.

 Fourth Quarter 2016 occupancy of 93.9% and

leased of 95.1% for our wholly-owned portfolio continue to provide significant internal growth as fundamentals improve.

 Targeted 2017 year-end occupancy of

94 – 95% and leased of 95 - 96%.

 Improved growth profile and strengthened our

balance sheet through the sale of $1.3 billion non-core assets at a blended 6.9% cap rate and the addition of high-quality developments since 2015.

 Achieve top quartile credit metrics to support

  • ur effort to raise our investment grade rating.

February 28, 2017

slide-2
SLIDE 2

Philadelphia

PENNSYLVANIA

Master Development Deal Structure

 5.1 million SF minimum build out, which equates to 255,000 SF

per year over 20 years

 52% office (including lab, academic space) or 2.6 million SF,

which equates to 130,000 SF per year over 20 years

 350,000 SF minimum building size  Land value approximates current market for development  Land for public space conveyed at nominal cost and

improvement costs fully recovered through future land releases

 99-year ground lease executed at commencement of each of the

six development phases

Schuylkill Yards

Master Development: Long-Term Flexibility

 Master plan approval: Initial phase approvals

expected by 2Q17. Currently zoned for 2.5M SF.

 Public Space: Design of Drexel Square directly

across 30th Street Station in process along with exterior improvements to One Drexel Plaza.

 Construction to start for both in 1H17 for

1H18 delivery.

 Low initial capital requirements: We anticipate

spending approximately $10 - $15 million over the next 24 months ahead of any property construction.

 Long Pre-Lease Timeline: First phase of new

construction totaling approximately 700,000 SF of

  • ffice/lab facility targeted for late 2019 / early 2020

delivery.

 Phased Development: Subsequent phases

developed over next 18+ years. Extension options allow Brandywine to extend an additional 10 years.

 Flexible Ownership: Brandywine has the ability to

have full ownership, bring in joint venture partners

  • r sell development phases to qualified

developers. Schuylkill Yards features 6.5 Acres of publicly accessible open space:

 A 1.3 acre public square in front of a redeveloped existing One Drexel Plaza.  A shared street esplanade along JFK Boulevard that reinforces the pedestrian connection between Drexel, 30th Street

Station, University City and the Armory.

 Over 1.5 miles of vibrant, active streetscapes complete with new pedestrian-friendly urban furniture and bicycle infrastructure.  Development Partners: Brandywine Realty Trust (Master Developer), Gotham Organization, Longfellow Real Estate Partners  Currently in the zoning approval and planning process.

slide-3
SLIDE 3

Construction continues on FMC Tower at Cira Centre South, Philadelphia’s first vertical neighborhood.

The project represents a high quality addition to Brandywine’s Philadelphia CBD portfolio. Tenants are increasingly seeking the kind of quality environments we specialize in creating. Philadelphia is a stable, and steadily accelerating, market - a top-ranked U.S. city featuring a major transportation hub, a growing residential population, one of the nation’s top two cultural scenes, and an increasingly friendly tax environment. Fueled by such growth industries as education and medicine, resoundingly attractive to millennials, and currently the nation’s eighth largest job center, Philadelphia is a walkable/bikeable city—perfectly positioned for meeting the demands of companies seeking an integrated business and cultural lifestyle—where over 40% of those who work in the city also choose to live there. FMC Tower at Cira Centre South capitalizes on these trends and creates a new standard of excellence to both office tenants and residents seeking a high quality integrated lifestyle. Class A office rents in Philadelphia’s top CBD tech market, University City, grew 25.4 percent to $47.66 from Q4 2014 to Q4 2016. University City also ranked second among the top tech submarkets in terms of net absorption growth, at 23.3 percent, behind only Tempe in Phoenix. (Source: CBRE) Direct average asking rent in the entire Philadelphia CBD have increased 7.7% YTD. (Source: JLL)

Philadelphia CBD Portfolio | Brandywine owns 58% of the Trophy Class Inventory with Occupancy at 97.0%

Growth Markets

Philadelphia

PENNSYLVANIA

slide-4
SLIDE 4

Brandywine has emerged as the leading office landlord in the highly dynamic Austin, Texas market, which is currently ranked second on the Forbes list for future job growth. Austin isn’t just one of the leading innovation centers in the world; it’s also one of “America’s 50 Best Cities” (Bloomberg Business Week), “The Next Biggest Boom Town in the U.S.” (Forbes); and the “Fastest Growing Major U.S. Metro Economy” (U.S. Conference of Mayors). Thanks to our joint venture, our recent land acquisitions, our 320,000 square foot Encino Trace development, and the 2015 acquisition of the 1.1 million square foot Broadmoor campus, Brandywine will continue to expand its leadership position in this key market for years to come. Metro DC is widely considered to be one of the most envied investment markets in the world and the nation’s top region for fastest growing private companies. The Washington Post has named the District as having the most educated residents in the country. And the Urban Land Institute has ranked Washington, DC, the nation’s second best real estate investment

  • market. All of this bodes extraordinarily well for

Brandywine’s regional portfolio as well as our proposed joint venture projects: 4040 Wilson

  • Blvd. in Arlington, VA; 25 M St. SE in the Capitol

Riverfront market in DC; and a mixed use site in the NOMA market of DC.

Washington

DISTRICT OF COLUMBIA

Austin

Texas

Growth Markets

slide-5
SLIDE 5

Fortress Balance Sheet

Reduce Leverage

Maximize Liquidity

Improve Operating Cash Flow

Increase common dividend Maximize Financi cial l Capacit ity in Uncer ertain Times

Continue to improve credit and coverage metrics

No wholly-owned floating rate exposure

Delever balance sheet, reduce cost of debt capital and lengthen debt maturities 2016 Financia cial Highli light ghts

49% adjusted FFO and 73% CAD payout ratio

Paid off our 2016 unsecured bonds with cash-on-hand

Increased common dividend 6.7% for July 2016 payment Balance ce Sheet et Objec ectives es

Continue deleveraging through asset sales program

Run company at 6.0x debt/EBITDA

  • r lower:

» As of 12/31/16, 6.6x debt/EBITDA and 38.3% net debt to total gross assets

Continually assess capital market

  • pportunities:

» Unsecured debt issuance; no anticipated issuance until mid-2017

Balance ce Sheet Managem emen ent

The Path Ahead 2017 Business Plan

Capital Recycling

Goal: Top 3 Landlord in Every Core Market

Lease vacant space!

Be a net seller while culling portfolio of slower growth assets » $200 00 million

  • n of sales

s target et in 2017; 17; $83 3 million

  • n already

dy close sed. d. » Develop urban, multimodal town center high quality growth acceleration properties

Increase investments in our core markets through development / redevelopment » FMC Tower at Cira Centre South (Philadelphia, PA)

Pursue growth opportunities in Philadelphia, Austin and Washington DC by acquiring key strategic land sites and continuing master planning activities on

  • ur key multi-phase / multi-year

development sites

Monetize non-core land holdings. As of 12/31/16, under agreement to sell $24 million of land parcels

Continue to reduce number of operating joint ventures

2017 7 Growth th Objecti ectives es

Growth th Strateg egy

Complete submarket refinement and increase revenue contributions from urban and town center product

Improve portfolio forward growth rates

Finalize exits from New Jersey and Delaware; reduce Northern Virginia and Maryland revenue contribution

Balance earnings stability during recycling through portfolio lease-up, rent growth and redeployment

Since 2009, Brandywine sold 13.4M SF for $2.2 billion ($164 PSF) at a 7.1% cap rate

Since 2009, Brandywine has purchased 4.4M SF of CBD/Town Center assets for $727 million ($164 PSF)

Submarket Refinement

Reduce commodity, suburban product

Portfol

  • lio

io Transfo sform rmati ation

  • n

Recycle, Redeploy and Create Achieve Top Quartile Peer Operating Fundamentals

Year-end occupancy ranging between 94-95%

Year-end forward leasing ranging between 95-96%

Deliver SS NOI growth of 0-2% (GAAP) and 6-8% (cash)

Keep capital costs between 10-15% of lease revenues

Balance portfolio stability and growth by lengthening lease terms, increasing annual rent escalations and reducing near term rollover exposure

80% achieved on our 2017 $28.7 million speculative revenue target (as of 1/20/17)

Opera rati tion

  • nal

al Excell llen ence

Stronger Forward Growth Profile

Lower Future Tenant Rollover

slide-6
SLIDE 6

Forward-Looking Statements

Certain statements in this brochure constitute “forward-looking statements” within the meaning of the Private Securities Litigation Reform Act of 1995. Such forward-looking statements involve known and unknown risks, uncertainties and other factors that may cause our and our affiliates’ actual results, performance, achievements or transactions to be materially different from any future results, performance, achievements or transactions expressed or implied by such forward-looking statements. Additional information on factors which could impact us and the forward-looking statements contained herein are included in our most recent annual and quarterly reports filed with the Securities and Exchange Commission. Please reference our supplemental package for definitions and reconciliations of non-GAAP financial measures.

High Quality ty Portfol

  • lio
  • in Stabl

ble e Markets ts (as of 01/20/17)

(1) Includes total number of properties and square footage, % of NOI based on BDN's ownership interest (2) Includes leases executed through 01/20/17 which will commence subsequent to 12/31/16

WHOLLY OWNED JOINT VENTURE TOTAL Submar arket # Prop SF SF # Prop SF SF # Prop SF SF Philadelphia CBD 11 5,358,118

  • 11

5,358,118 PA Crescent Markets 27 3,286,376 5 226,161 32 3,512,537 Dulles Toll Road 13 2,377,479

  • 13

2,377,479 Austin – Broadmoor 6 962,975

  • 6

962,975 Wilmington CBD 2 501,399

  • 2

501,399 Silver Spring / Bethesda

  • 4

733,256 4 733,256 Total 59 59 12,48 ,486, 6,347 347 9 959,4 9,417 17 68 68 13,44 ,445, 5,764 764

Portfol

  • lio Shift

t

Urba ban n Town n Center nters Compr mprise 54% of Total SF and d 77% of NOI

Region

  • n

# of Propert rties Square re Feet % of Total SF 4Q ‘16 % of NOI % % Occupied % % Lease ased(2)

  • Phila. CBD

11 5,358,118 21.4% 32.2% 97.0% 98.1% PA Suburbs 60 5,724,994 22.9% 27.8% 93.7% 94.3% Metro D.C. 26 4,408,781 17.6% 18.1% 87.3% 89.0% Austin, TX 25 3,698,094 14.8% 13.0% 93.2% 96.3% Subtotal al 122 122 19,18 ,189, 9,987 987 76.8% .8% 91.1% .1% 93.0% .0% 94.5% .5% Other 66 4,288,498 17.2% 4.9% 90.5% 92.2% Dev/Redev 7 1,523,587 6.1% 4.1% Total 195 195 25,00 ,002, 2,072 072 100.0 0.0% 100.0 0.0% 92.6% .6% 94.1% .1%

Wholly y Owned d and Joint nt Ventur ure Prope perties(1)

Key 2017 7 Business ness Plan Goals s (as of 01/20/17)

Same Store NOI Increa ease se

GAAP 0-2% CASH 6-8%

Rental Rate Increa ease se

GAAP 5-7% CASH 8-10%

Year-end SS Occupancy 94-95%

Year-end Core Occupancy 94-95%

Year-end Core Leased 95-96%

Funds from Operations $1.35 - $1.42

Cash Available for Distribution Payout Ratio 71% - 64%

Dispositions $200.0MM target 42% achieved

Acquisitions None incorporated

Spec Revenue $28.7MM

Leasing Capital PSF / YR $2.00 - $2.50

Average Lease Term 7.0 Years

2017 7 Capita tal Plan

Uses (MM) 2017 2017

Dividends $ 117 Mort Amortization 5

  • Rev. Maint’g. Cap Ex

34

  • Rev. Creating Cap Ex

38 Bond/Preferred Stock 400 Dev/Redev Projects 155 JV Investments 23 Total Uses $ 772

Sourc rces (MM)

CF After Interest Pmts. $192 Sales 200 Term Loan 250 JV Financing (Encino Trace) 15 LOC Borrowings Decrease to Cash 115 Total Sourc rces $ 772 12/31 /31/17 /17 E LOC: $ 0 Cash: $85

Liqui uidi dity ty

2355 Dulles Corner, Herndon, VA