
SLIDE 1
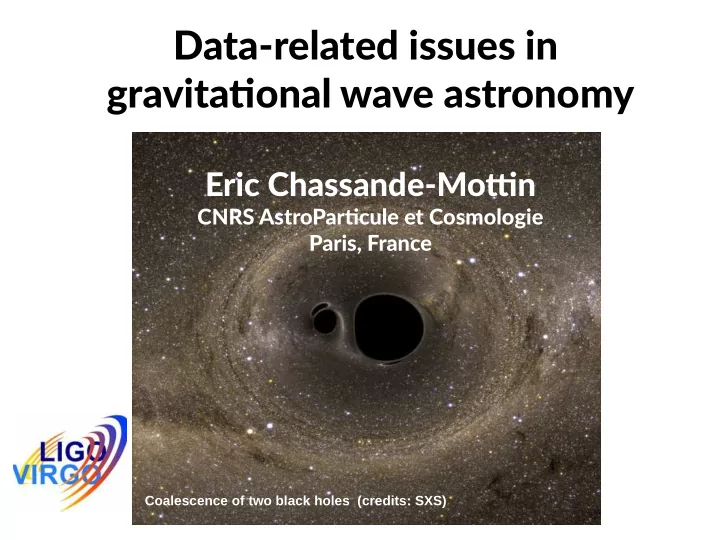
Coalescence of two black holes (credits: SXS)
Data-related issues in gravitatjonal wave astronomy Eric - - PowerPoint PPT Presentation
Data-related issues in gravitatjonal wave astronomy Eric Chassande-Mottjn CNRS AstroPartjcule et Cosmologie Paris, France Coalescence of two black holes (credits: SXS) Outline Context direct detection of gravitational waves Eric
Coalescence of two black holes (credits: SXS)
– VO and multimessenger astronomy – Vision for the next future – open data
GW signal received by the LIGO detectors
highly signifjcant events with FARs < 1/century
hole mergers in future runs
stars
formation, tests of GR, cosmology?)
based astronomy EM counterpart to GW is the next “big thing”
[few 100 GB – This is a small subset of full raw data – many TB]
– GW event descriptor (VOevent) and skymap [small volume] – Distributed to MOU partners over a private GCN-type network – Policy: release public alerts after 4 published events (O3 ?)
– Posterior samples from Bayesian parameter estimations
– Intro on VO/tutorial on VO tools – Electromagnetic follow-up
– Open science data
https://www.asterics2020.eu/dokuwiki/doku.php?id=open:wp4:wp4gwstrasbourg2016
–
Goal for next run: ~10 mins
–
Distributed in various formats including VOevent
–
Where to point first? Strategy to prioritize fields in order to maximize chance of detection
Skymap from GW data 600 deg2 – will improve with more detectors (Virgo)
–
Visualize, tile and combine skymaps with other information (e.g., galaxy catalog for “mass targetting”)
–
On-going collaboration to demonstrate usage of VO tools (Multi Order Coverage Map)
–
Skymaps will soon include a distance estimate for binary mergers
Credits: Giuseppe Greco (INFN)
– Maximize science impact – Long-term preservation – Facilitate access to collaborators
–
h(t) @ 4kHz and 1-Hz data quality bitmask in frame format, HDF5, txt.gz
–
Test signals (injections), documentation, tutorials
(2006-10, ~2.5 yrs total) (1 hr)
[…] #--------------------- # Plot the time series #---------------------- fig = plt.figure(figsize=(10,10)) fig.subplots_adjust(wspace=0.3, hspace=0.3) plt.subplot(321) plt.plot(time_seg - time_seg[0], strain_seg) plt.xlabel('Time since GPS ' + str(time_seg[0])) plt.ylabel('Strain') #------------------------------------------ # Apply a Blackman Window, and plot the FFT #------------------------------------------ window = np.blackman(strain_seg.size) windowed_strain = strain_seg*window freq_domain = np.fft.fft(windowed_strain) freq = np.arange(0, fs, 1.0/length) plt.subplot(322) plt.loglog( freq, abs(freq_domain)/4096.0) plt.axis([10, fs/2.0, 1e-24, 1e-18]) plt.grid('on') plt.xlabel('Freq (Hz)') plt.ylabel('Strain / Hz$^{1/2}$') #---------------------------------- # Make PSD for first chunk of data #---------------------------------- plt.subplot(323) Pxx, freqs = mlab.psd(strain_seg, Fs = fs, NFFT=fs) plt.loglog(freqs, Pxx) plt.axis([10, 2000, 1e-46, 1e-36]) plt.grid('on') plt.ylabel('PSD') plt.xlabel('Freq (Hz)') #------------------------- # Plot the ASD #------------------------------- plt.subplot(324) plt.loglog(freqs, np.sqrt(Pxx)) plt.axis([10, 2000, 1e-23, 1e-18]) plt.grid('on') plt.xlabel('Freq (Hz)') plt.ylabel('Strain / Hz$^{1/2}$') [...]
iPython notebooks for demos using LIGO data Credits: https://www.losc.caltech.edu
– Aladin customization for GW skymap handling – Glade galaxy catalog pushed to VizieR – Multi-dimensional cross-matching tool
– Footprints for robotic telescope pointings with time stamps
– Inclusion of time series observations in VO is still to be defined – Internal discussion in Virgo about Open Science Center.
Four low-latency search pipelines T0+3 min = Event uploaded to DB T0+17 min = First sky map T0+2 days = Alert sent T0+2 months = Final sky map GW error region is ~600 deg2
With Virgo on, with full sensitjvity, the GW error region reduces to ~10 deg2
BBH with very small separation formed in the collapse of a massive star, resulting in GRB nearly simultaneously with GWs? (Loeb, 2016) Unusually long-lived disk around BBH produces GRB at the time
Strong disk wind may be driven by radiation or magnetic fields → Fast optical transient around 22 mag in V-band may be produced when thermal photons break out of the outflow Ultra-fast flow associated with a mini-disk wind develops a blast wave which decelerates and can generate a radio afterglow
1.4 GHz
From Corsi, talk at APS April 2016 Murase et al Astrophys.J. 822 (2016) L9 Yamazaki et al. arXiv:1602.05050