search for the gravity wave signature of search for the
play

Search for the gravity wave signature of Search for the gravity wave - PowerPoint PPT Presentation

Laser Interferometer Gravitational- -Wave Observatory (LIGO) Wave Observatory (LIGO) Laser Interferometer Gravitational Search for the gravity wave signature of Search for the gravity wave signature of GRB030329/SN2003dh GRB030329/SN2003dh


  1. Laser Interferometer Gravitational- -Wave Observatory (LIGO) Wave Observatory (LIGO) Laser Interferometer Gravitational Search for the gravity wave signature of Search for the gravity wave signature of GRB030329/SN2003dh GRB030329/SN2003dh ABSTRACT One of the major goals of gravitational wave astronomy is to explore the astrophysics of phenomena that are already observed in the particle/electromagnetic bands. Among potentially interesting sources for such collaboration are gravitational wave searches in coincidence with Gamma Ray Bursts. On March 29, 2003, one of the brightest ever Gamma Ray Burst was Optimal detected and observed in great detail by the broader astronomical community. The uniqueness Integration length of this event prompted our search as we had the two LIGO Hanford detectors in coincident lock at the time. We will report on the GRB030329 prompted search for gravitational waves, which relies on our sensitive multi-detector data analysis pipeline specifically developed and tuned for Well detectable Sine- astrophysically triggered searches. We did not observe a gravity wave burst, which can be Gaussian simulation simulation associated with GRB030329. However, the search provided us with an encouraging upper limit on the associated gravity wave strain at the Hanford detectors.
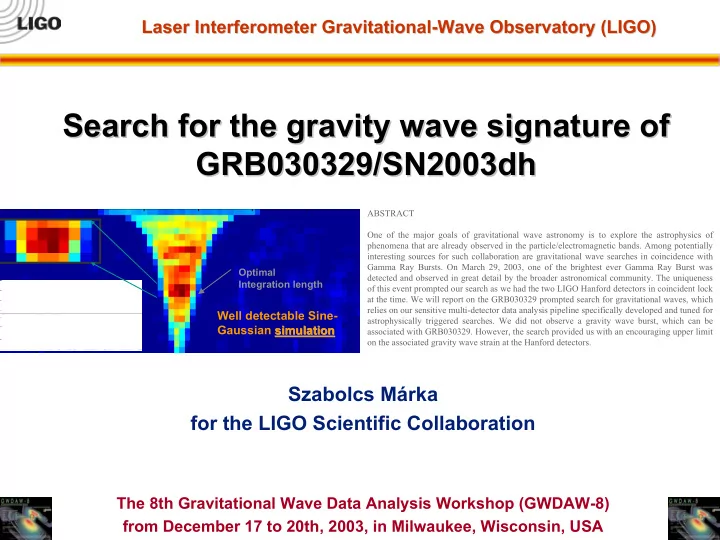
 Szabolcs Márka for the LIGO Scientific Collaboration The 8th Gravitational Wave Data Analysis Workshop (GWDAW-8) 1/13/2004 LIGO/Caltech from December 17 to 20th, 2003, in Milwaukee, Wisconsin, USA

  2. Externally initiated search for gravity waves Externally initiated search for gravity waves Violent cosmic events can be seen as optical supernovae, neutrino bursts, GRBs, etc… We expect such events to produce a significant flux of gravitational waves in the LIGO frequency band. Various trigger and data distribution networks: Measured trigger properties International Supernovae Network (I.S.N.) Time of arrival Supernovae Early Warning System (SNEWS) Source direction The GRB Coordinates Network (GCN) Duration, distance, type, etc… The third InterPlanetary Network (IPN3) …. Targeted coherent search for gravity wave counterpart Timing and direction information is crucial for improved efficiency Measured parameters are essential for astrophysical interpretation of results Each trigger type has advantages and disadvantages 1/13/2004 LIGO/Caltech

  3. Gamma- -Ray Bursts (GRB) Ray Bursts (GRB) Gamma � Gamma-Ray Bursts (GRB) are short but very energetic pulses of gamma-rays emitted at cosmological distances. � They originate from ‘random’ sky locations (~isotropically distributed on the sky). � They are quite frequent and their detection rate can be as high as one event a day. � They are the result of various ultra-relativistic processes, and can be accompanied by X-ray, radio and/or optical afterglows. GRBs require very energetic sources (10 51 - 10 53 erg), and can be as short as 10 ms and as long as � 100 s. GRBs can be classified based on their duration as “short” (<2s) and “long” (>2s). � � The present consensus is that GRB emission is associated with black hole formation processes such as hypernovae, compact binary inspirals and collapsars. A very good reason to expect strong association between GRBs and gravitational waves. » They are short, violent events that could produce significant fractions of a solar mass of gravitational waves within the LIGO band » The frequency of the waves could be set by the timescale associated with the black hole dynamics, which allows for “high frequency” gravitational waves. Relatively large number of events are detected (Statistical analysis approaches are useful!) Good timing information Various levels of source direction information Usual sources are at very large distances Model dependent results Only 1 in ~500 GRBs are detected by present satellites 1/13/2004 LIGO/Caltech

  4. GRBs and their coverage during S2/DT8 and their coverage during S2/DT8 GRBs http://darkwing.uoregon.edu/~ileonor/ligo/s2/grb/s2grbsligotama.txt http://darkwing.uoregon.edu/~ileonor/ligo/s2/grb/s2grbstama.html 1/13/2004 LIGO/Caltech

  5. GRB030329 GRB030329 http://space.mit.edu/HETE/Bursts/GRB030329/ TITLE: GCN GRB OBSERVATION REPORT NUMBER: 2120 SUBJECT: GRB 030329: Supernova Confirmed DATE: 03/04/08 20:13:40 GMT FROM: T. Matheson et al. “…The spectral features discovered by Matheson et al. (GCN 2107) and confirmed by Garnavich et al. (IUAC 8108) continue to develop. Subtracting a scaled version of the Apr. 4.27 UT power-law spectrum from the Apr. 8.13 spectrum reveals an energy distribution remarkably similar to that of the SN1998bw a week before maximum light (Patat et al. 2001, ApJ, 555, 900). This spectrum can be seen at http://cfa-www.harvard.edu/~tmatheson/compgrb.jpg The spectral similarity to SN 1998bw and other 'hypernovae' such as 1997ef (Iwamoto et al. TITLE: GCN GRB OBSERVATION REPORT NUMBER: 2176 SUBJECT: 2000, ApJ, 534, 660) provides strong evidence GRB030329 observed as a sudden ionospheric disturbance (SID) DATE: 03/04/28 that classical GRBs originate from core-collapse 22:38:19 GMT FROM: Doug Welch et al., supernovae. This message may be cited. “…A disturbance of the Earth's ionosphere was observed coincident with the HETE detection of GRB030329. This SID was seen as an increase in the signal strength from a Low Frequency (LF) radio beacon received in Kiel, transmitted as a time signal from station HBG (75 kHz) near Geneva, 920 km from the receiver. (Note: http://www.cerncourier.com/main/article/43/7/12 This is not a radio detection of GRB030329; this disturbance was caused by the “…We've been waiting for this for a long, long time," said lead author prompt X-rays and/or gamma-rays from GRB030329 ionizing the upper atmosphere Jens Hjorth. "This GRB gave us the missing information. From these and modifying the radio propagation properties of the Earth's ionosphere.) Due to detailed spectra we can now confirm that this burst, and probably the sub-burst longitude and latitude and the geographical distribution of LF/VLF other long GRBs, are created through the core collapse of massive beacons and monitoring stations, this was the only recording (positive or negative) stars. Most other leading theories are now unlikely…" where GRB030329 illuminated the ionosphere along a signal path. …” 1/13/2004 LIGO/Caltech

  6. Signal region and GRB030329 trigger Signal region and GRB030329 trigger - Theories prefer - very short ~10ms burst - long (~1-10s) quasi-sinusoids (Araya-Góchez, M. Van Putten) “All inclusive” All inclusive” - Relative delay between the gravity “ signal region signal region wave and GRB is predicted to be small ~O(s) (180 seconds total) (180 seconds total) - Signal region: [ To-120s, To+60s ] to cover most predictions - Model specific ranges can also be considered - Known direction - Optical counterpart located http://www.mpe.mpg.de/~jcg/grb030329.html - LIGO antenna factor identified - LIGO/TAMA arrival times are known - Source distance is known - z=0.1685 (d~800Mpc) - Unknown waveform/duration 1/13/2004 LIGO/Caltech

  7. Schematic analysis flow chart Schematic analysis flow chart External Trigger Data Astrophysically motivated simulations Adaptive pre - conditioning Non-parametric, coherent, multi-interferometer GW detection algorithm Background region Simulations Signal region False detection rate Largest event Candidates Efficiency Measurements 1/13/2004 LIGO/Caltech Threshold Upper limits Threshold

  8. Cross- -correlated signal anatomy I. correlated signal anatomy I. Cross “Small” Sine-Gaussian Integration length [ 4-120 ms, uneven steps ] F = 361Hz, Q = 8.9 h RSS ~ 3x10 -21 [1/ ⌦ Hz] Optimal integration “Huge” Sine-Gaussian Noise examples F = 361Hz, Q = 8.9 Optimal h RSS ~ 6x10 -20 [1/ ⌦ Hz] integration Time [ ~ms ] Sine-Gaussian (SG) F = 361Hz, Q = 8.9 - Co Co- -located detectors can have correlated signals located detectors can have correlated signals - Various environmental effects Example: - The optimal integration length depends on: The optimal integration length depends on: - the base noise - the signal duration - the signal strength 1/13/2004 LIGO/Caltech

  9. Cross- -correlated signal anatomy II. correlated signal anatomy II. Cross Event strength [ES] calculation: [1/ ⌦ Hz] Average value of the “optimal” pixels Optimal Integration 4 3 2 1 length 5 Notes: Notes: Color coding: “Number of variances above mean” [ES’] The pipeline is based on relative measurements Raw data and raw data with injections are processed through the very same pipeline Calibrated injections are cross verified to LDAS The method targets only short bursts 1/13/2004 LIGO/Caltech

  10. False alarm rate measurement False alarm rate measurement example example Estimated rate: ~1/15 - - 1/20 in 180s 1/20 in 180s ~1/15 Note: Preliminary information ! Note: Preliminary information ! Based on ~15 ks of H1 & H2 covering the coincident lock stretch around the GRB030329 trigger Note that this rate estimate is based on a small number of events in the tail, therefore it should be treated with some caution 1/13/2004 LIGO/Caltech Note: We only relied on the co-located LHO LHO 2K and 4K interferometers for this analysis! 2K and 4K

Download Presentation
Download Policy: The content available on the website is offered to you 'AS IS' for your personal information and use only. It cannot be commercialized, licensed, or distributed on other websites without prior consent from the author. To download a presentation, simply click this link. If you encounter any difficulties during the download process, it's possible that the publisher has removed the file from their server.

Recommend


More recommend