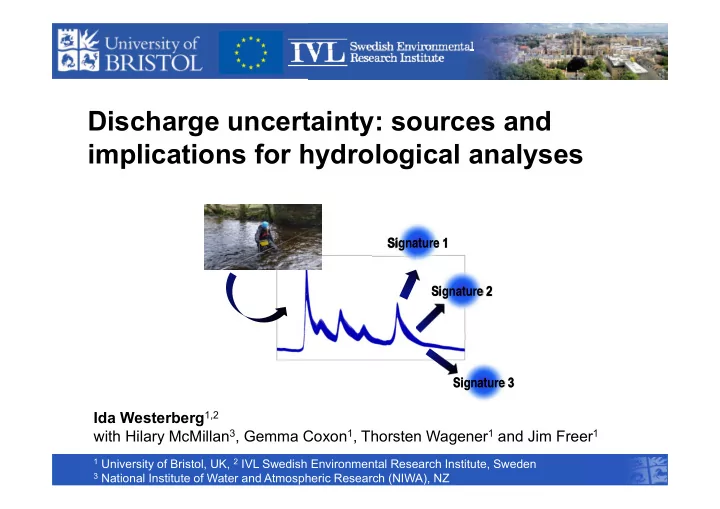
SLIDE 1 Discharge uncertainty: sources and implications for hydrological analyses
Signature 1 Signature 1
http://comm
dia.org/wiki/ File:Piasnic a- wodowskaz
Signature 2 Signature 2 Signature 3 Signature 3
Ida Westerberg1,2 with Hilary McMillan3, Gemma Coxon1, Thorsten Wagener1 and Jim Freer1
1 University of Bristol, UK, 2 IVL Swedish Environmental Research Institute, Sweden 3 National Institute of Water and Atmospheric Research (NIWA), NZ
SLIDE 2
Uncertainties in discharge data reduce their information content for hydrological analyses – and the reliability of the knowledge we infer from these analyses
Why Study Discharge Uncertainty?
Signature 1 Signature 1 Signature 2 Signature 2
SLIDE 3
Overview
Sources of discharge uncertainty Rating-curve uncertainty estimation for 43 UK catchments mplications of rating-curve uncertainty for uncertainty in hydrological signatures (i.e. flow ndices)
SLIDE 4 Discharge Measurement
ischarge derived from stage using a rating curve at most stations
he rating curve is fitted to gaugings of stage and discharge
0.2 0.4 0.6 0.8 2 4 6 8 10 Stage (m) Discharge (m3/s)
SLIDE 5 Discharge Uncertainty Sources
auging measurement uncertainty eatory) ating curve approximation of true age-discharge relation (epistemic)
Extrapolation to ungauged flow conditions Variable backwater and hysteresis Seasonal weed growth, erosion/sedimentation
- ntinuous measurement of water level
me series
SLIDE 6
Rating Curve Uncertainty Sources
High flows - Hysteresis? High flows - Extrapolation
SLIDE 7 Rating Curve Uncertainty Sources
Low flows - seasonal weed growth High flows – Backwater? Earlier rating
www.ceh.ac.uk/data/nrfa/data/station.html?52010
SLIDE 8 How to estimate the uncertainty?
- Epistemic uncertainty about
information content in gauging data:
- Which points are outliers and
which points have information about the stage-discharge relation?
- How has the stage-discharge
relation varied in time?
SLIDE 9
Discharge Uncertainty Estimation
certainty Sources
ting curve approximation of e stage-discharge relation pistemic uncertainty => all uged points may not be mpatible with one rating curve)
Uncertainty Estimation
Sample multiple rating curves in Monte Carlo analysis Let gauging points “vote” for each curve using Voting Point likelihood Based on official rating curve form Aims to represent total uncertainty (aleatory and epistemic)
McMillan & Westerberg, HP 2015
SLIDE 10 Rating curve uncertainty for 43 UK catchments
ata
Rating curves with corresponding gauging data 15-minute water levels for 2003–2008 43 catchments classified as having a natural flow regime Signatures calculated at the hourly time scale Official rating 2003-2008
Discharge (m3/s)
0.2 0.4 0.6 0.8 1 1.2 1.4 1.6 1.8 20 40 60 80 100 120 140 Percentile (%) 10 20 30 40 50 60 70 80 90
Comparable to historic rating variability (stable site)
SLIDE 11
Rating curve and signature uncertainty
Signature uncertainty = combination of rating curve uncertainty & flow series variability Low flows High flows Flow percentiles
SLIDE 12
Flow percentiles
SLIDE 13
Flow percentiles
SLIDE 14
Flow percentiles
SLIDE 15
Gauged signature uncertainty
Relative uncertainty
Uncertainty can obscure interpretation of differences between catchments
Mean flow Slope of FDC
SLIDE 16 Relative uncertainty magnitudes (halfwidths of 5- 95 percentile ranges)
Signatures
Uncertainty
Factors affecting uncertainty
,
Average flow conditions Low: ±10% Medium: ±12-15% High: ±30-40%
Large gauging scatter for whole flow range, or range contributing most of total flow volume.
Low flows Low: ±15-20% Medium: ±30-40% High: ±70-90%
Scatter in low flow gaugings (e.g. weed growth or riverbed erosion)
High flows Low: ±10-15% Medium: ±20-30% High: ±30 60%
High flow uncertainty. Extrapolation and/or scatter in high flow gaugings
SLIDE 17 Discussion - Rating curve and discharge uncertainty
Place-specific variability with flow range Causes systematic uncertainty in discharge data Small rivers with large flow variability and fast rainfall-runoff response impedes reliable gauging Voting Point likelihood method – generating multiple feasible rating curve samples allows assessment of uncertainty impact
- n any subsequent analysis
- Uncertainty estimations for a wide range of multi-section
rating curves and different error sources
- Aimed to be a practical method (no detailed hydraulic
information about stations)
- Important to check estimations against available metadata
(e.g. to avoid unreliable out-of-bank extrapolation)
SLIDE 18 Discussion – Impacts on signature uncertainty
Signature uncertainty = combination of rating curve uncertainty & flow series variability Largest uncertainty for signatures describing high/low flow magnitude and dynamics (medium level ±30-40%) Lowest for average flow conditions (medium level ±12-15%) Important implications for cross-catchment comparisons, model calibration, trend analyses, flood/drought studies and nutrient load estimation
- Understanding rating curve uncertainty is key to
understanding discharge data information content
- Are some flows extrapolated or out of bank?
- Has the station and rating curve uncertainties changed
with time?
SLIDE 19
Questions?
nowledgements
his research was funded by a Marie Curie Intra European Fellowship within the 7th uropean Community Framework Programme ream discharge stage data and rating curve information has been supplied by the