
1
1
CS533
Modeling and Performance Evaluation of Network and Computer Systems
Monitors
(Chapter 7)
2
Monitors
- A monitor is a tool
used to observe system
– Observe performance – Collect performance statistics – May analyze the data – May display results – May even suggest remedies
- Systems programmer may
profile software
- System manager may
measure resource utilization to find bottleneck
- May use to tune system
- May use to characterize
workload
- May use to develop models
- r inputs for models
That which is monitored improves. – Source unknown
3
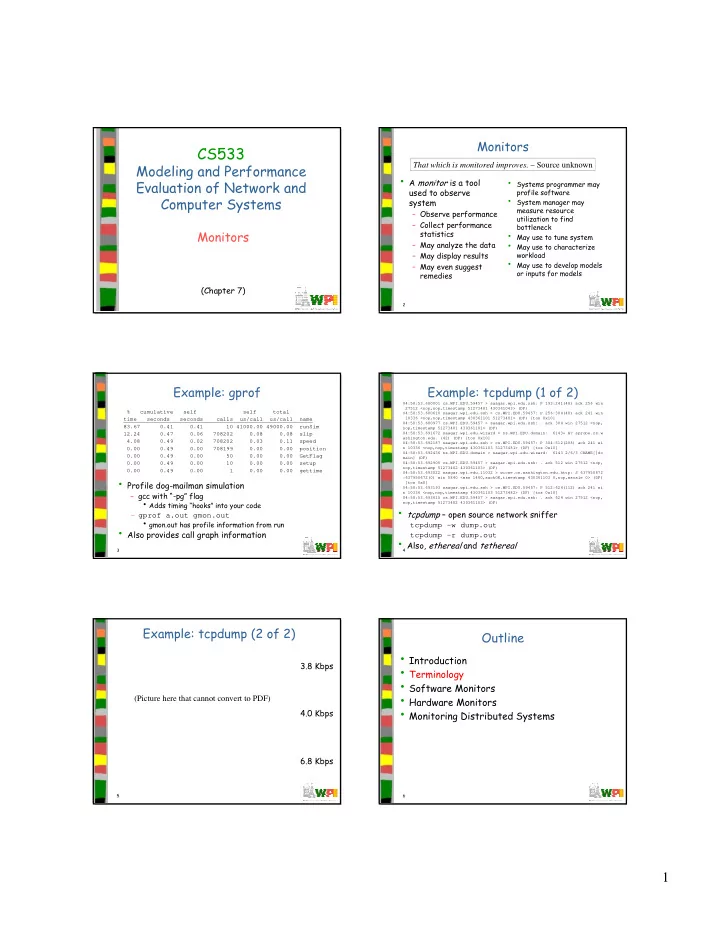
Example: gprof
- Profile dog-mailman simulation
– gcc with “-pg” flag
- Adds timing “hooks” into your code
– gprof a.out gmon.out
- gmon.out has profile information from run
- Also provides call graph information
% cumulative self self total time seconds seconds calls us/call us/call name 83.67 0.41 0.41 10 41000.00 49000.00 runSim 12.24 0.47 0.06 708202 0.08 0.08 slip 4.08 0.49 0.02 708202 0.03 0.11 speed 0.00 0.49 0.00 708199 0.00 0.00 position 0.00 0.49 0.00 50 0.00 0.00 GetFlag 0.00 0.49 0.00 10 0.00 0.00 setup 0.00 0.49 0.00 1 0.00 0.00 gettime
4
Example: tcpdump (1 of 2)
- tcpdump – open source network sniffer
tcpdump –w dump.out tcpdump –r dump.out
- Also, ethereal and tethereal
04:58:53.680001 cs.WPI.EDU.59457 > saagar.wpi.edu.ssh: P 193:241(48) ack 256 win 27512 <nop,nop,timestamp 51273481 430361043> (DF) 04:58:53.680610 saagar.wpi.edu.ssh > cs.WPI.EDU.59457: P 256:304(48) ack 241 win 10336 <nop,nop,timestamp 430361101 51273481> (DF) [tos 0x10] 04:58:53.680977 cs.WPI.EDU.59457 > saagar.wpi.edu.ssh: . ack 304 win 27512 <nop, nop,timestamp 51273481 430361101> (DF) 04:58:53.691672 saagar.wpi.edu.wizard > ns.WPI.EDU.domain: 6143+ A? sprobe.cs.w ashington.edu. (42) (DF) [tos 0x10] 04:58:53.692187 saagar.wpi.edu.ssh > cs.WPI.EDU.59457: P 304:512(208) ack 241 wi n 10336 <nop,nop,timestamp 430361103 51273481> (DF) [tos 0x10] 04:58:53.692436 ns.WPI.EDU.domain > saagar.wpi.edu.wizard: 6143 2/6/3 CNAME[|do main] (DF) 04:58:53.692905 cs.WPI.EDU.59457 > saagar.wpi.edu.ssh: . ack 512 win 27512 <nop, nop,timestamp 51273482 430361103> (DF) 04:58:53.693022 saagar.wpi.edu.11032 > wicse.cs.washington.edu.http: S 637950672 :637950672(0) win 5840 <mss 1460,sackOK,timestamp 430361103 0,nop,wscale 0> (DF) [tos 0x8] 04:58:53.693193 saagar.wpi.edu.ssh > cs.WPI.EDU.59457: P 512:624(112) ack 241 wi n 10336 <nop,nop,timestamp 430361103 51273482> (DF) [tos 0x10] 04:58:53.693615 cs.WPI.EDU.59457 > saagar.wpi.edu.ssh: . ack 624 win 27512 <nop, nop,timestamp 51273482 430361103> (DF) 5
Example: tcpdump (2 of 2)
3.8 Kbps 4.0 Kbps 6.8 Kbps (Picture here that cannot convert to PDF)
6
Outline
- Introduction
- Terminology
- Software Monitors
- Hardware Monitors
- Monitoring Distributed Systems