
SLIDE 1
PT DSN Tbk 2014 Operating Results Update
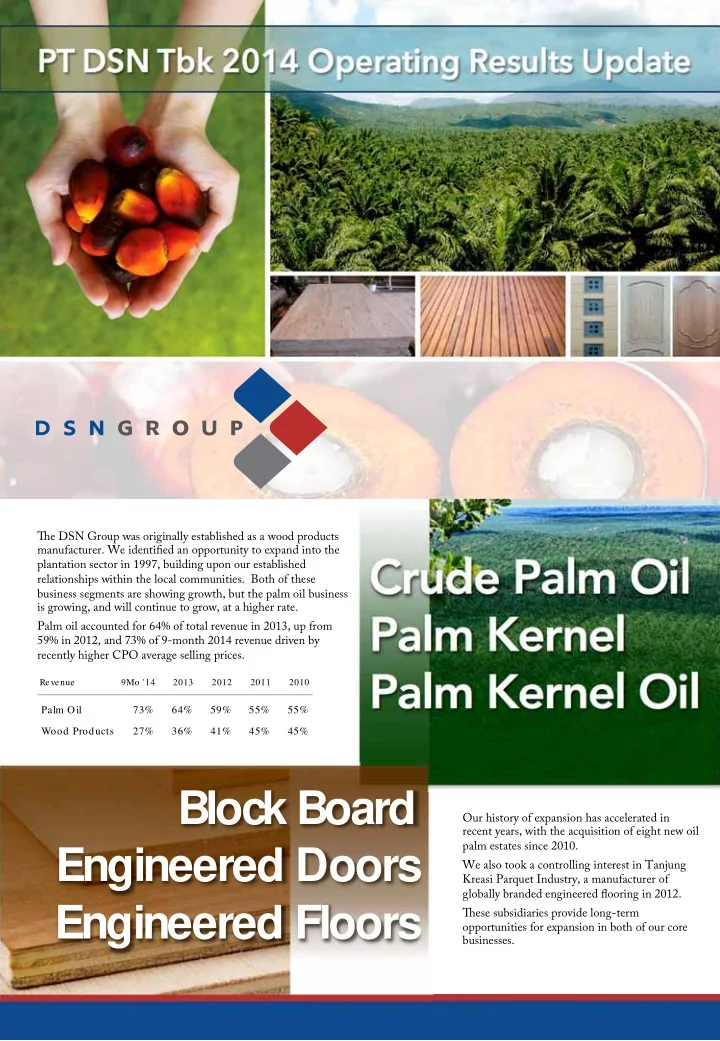
Tie DSN Group was originally established as a wood products- manufacturer. We identifjed an opportunity to expand into the
- pportunities for expansion in both of our core
Crude Palm Oil Palm Kernel Palm Kernel Oil Block Board Engineered Doors Engineered Floors
Revenue 9Mo '14 2013 2012 2011 2010 Palm Oil 73% 64% 59% 55% 55% Wood Products 27% 36% 41% 45% 45%