
SLIDE 1
New Britain Palm Oil Ltd
2012
New Britain Palm Oil Ltd 2012 New Britain Palm Oil Ltd 2012 New - - PowerPoint PPT Presentation
New Britain Palm Oil Ltd 2012 New Britain Palm Oil Ltd 2012 New Britain Palm Oil Ltd 2012 February 2012 Preliminary Results 2011 1 Recently upgraded facilities on New Britain 2 Introduction New Britain Palm Oil Ltd 2012 Record
2012
2012
1
2012
February 2012
2
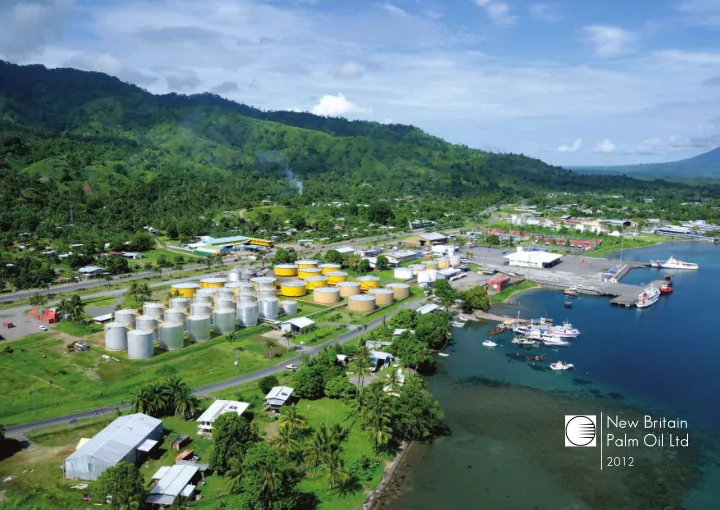
Recently upgraded facilities on New Britain
3
2012
economies and rise of the middle class
4
NBPOL plantation in West New Britain, PNG
5
2012
2011 2010
FFB processed (million tonnes) 2.4 1.9 CPO / PKO produced (tonnes) 591,477 478,667 Average CPO price achieved ($ / tonne) $1,108 $850
2011 2010
Revenue ($m) 780 461 EBITDA* ($m) 337 179 Profjt before tax* ($m) 276 131 Earnings per share* (US ¢) 141 60
* Excluding IAS 41
21% 24%
69% 88%
110% 134% 30%
6
Nursery estates in New Britain
7
2012
been received
$1,057/tonne
Fats plant has been commissioned
2012, taking the full year gross 2011 dividend to $0.30 per NBPO share
8
Milling in progress
9
2012
NBPOL share price (GBp) CPO $ / MT
2,000 1,800 1,600 1,400 1,200 1,000 800 600 400 1100 1000 900 800 700 600 500 400 300 200 100 12/05 06/06 12/06 06/07 12/07 06/08 12/08 06/09 12/09 06/10 12/10 06/11 12/11 CPO CIF Rotterdam (US$/MT) NBPOL share price (GBp) 2004 2005 2006 2007 2008 2009 2010 2011 Revenue PBT 900 800 700 600 500 400 300 200 100
$m Note: excluding effects of IAS41
10
NBPOL nursery, critical for expansion schedule
11
2012
Growth in Group Fresh Fruit Bunch (FFB) volume
Growth in Palm Oil Produced Tonnes Growth in Oil Palm Plantations
30,000 35,000 15,000 20,000 25,000 2004 2006 Hectares 2005 2007 10,000 5,000 40,000 45,000 2008 55,000 60,000 50,000 65,000 70,000 2009 2010 CAGR:17.5% 75,000 2011 80,000 85,000 Tonnes FFB 2004 2006 2005 2007 2008 2009 2010 2011 2004 2006 2005 2008 2007 2009 2010 2011 200,000 240,000 80,000 120,000 160,000 40,000 280,000 320,000 360,000 400,000 440,000
CAGR: 16.3%
480,000 520,000 560,000 600,000 1,400,000 1,500,000 1,100,000 1,200,000 1,300,000 1,000,000 1,600,000 800,000 1,800,000 2,000,000
C A G R : 1 5 . %
1,900,000 1,700,000 900,000 2,100,000 2,200,000 2,300,000 2,400,000 2,500,000
12
NBPOL and RAIL maintain a stock of cattle (of >19,000 head) utilising Palm Kernel Expeller, a high protein co-product
13
2012
50 100 150 200 250 300 350 400 12/2007 06/2008 12/2008 06/2009 12/2009 06/2010 12/2010
100 = NBPOL IPO in London (Dec. 2007)
06/2011 450 12/2011 06/2012 CPO CIF Rotterdam FTSE 250 NBPOL share price
14
Oil palm nursery
15
2012
US$/tCPO
Cost of production (CoP) at NBPOL Total NBPOL Land Bank
productive and highest margin estates
NBPOL estates
hectares of land designated for new oil palm plantations
being acquired by NBPOL to ultimately form new oil palm plantations
01/01/2006 01/01/2007 01/01/2008 01/01/2009 01/01/2010 01/01/2011 01/01/2012 200 400 600 800 1,000 1,200 1,400 CoP - West New Britain NBPOL estates CoP - KPOL estates CoP - NBPOL Group CPO - CIF Rott
Existing NBPOL oil palm estates Land owned and available for planting by NBPOL NBPOL sugar estates Land in process of acquisition
16
Recently upgraded storage tanking owned by NBPO at Kimbe port, PNG
17
2012
$27,562 $8,670 KPOL at time of acquisition NBPOL (as at Jan 2012)
25,000 20,000 15,000 10,000 5,000
EV ($) / Mature Hectare
EV ($) / Ha Taking into account mature
c.68,000 managed mature hectares within the enlarged NBPOL group
30,000 35,000
18
Harvesting techniques Pollinisation and breeding programme
19
2012
12.50 12.00 11.50 11.00 10.50 10.00 9.50 9.00 8.50 8.00
1989/1990 1990/1991 1991/1992 1992/1993 1993/1994 1994/1995 1995/1996 1996/1997 1997/1998 1998/1999 1999/2000 2000/2001 2001/2002 2002/2003 2003/2004 2004/2005 2005/2006 2006/2007 2007/2008 2008/2009 2009/2010 2010/2011 2011/2012
Edible Oils - World Stocks:Usage Ratio (%)
Source: USDA
%
20
The controlled cultivation of oil palms in the nursery contributes to NBPOL’s successful replanting programme and relatively young
21
2012
to yield fruit
Source: USDA
Crop composition of land used globally to produce vegetable oils Composition of global vegetable oil production
Soya Sunseed Rape Palm
37% 16% 11% 36% 62% 17% 15% 6%
NBPOL Example Customers
US$ contracts
Globally achieved Oil yield (tonnes / Ha) 0.5 1.0 1.5 2.0 2.5 3.0 3.5 4.0 4.5 Palm Oil (World Average) Rape Sun Soya
Source: USDA/NBPOL
5.0 5.5 6.0 Palm Oil (NBPOL) 6.5 Indicative oil yields
22
Palm oil shipment from PNG into the UK refjnery
23
2012
managed oil palm plantations
cultivated by smallholders
land area with 102,231 under cultivation
PAPUA NEW GUINEA NEW BRITAIN NEW IRELAND SOLOMON ISLANDS AUSTRALIA
Main area of NBPOL operation 36,126 hectares oil palm Lae• RAIL
10,685 hectares oil palm 7,720 hectares sugar cane 8,888 hectares pasture
11,134 hectares oil palm
8,533 hectares oil palm
6,318 hectares oil palm KPOL, Poliamba
5,536 hectares oil palm New Britain Oils The fjrst fully segregated and traceable sustainable palm oil refjnery in the UK. New bakery foodstuffs facility now completed
24
Sterilisation of palm fruits, key fjrst stage processing
25
2012
Revenue contribution Plantations
with respect to oil palm
by small-holders supplying NBPOL Milling and Refjning
Ferrero Infrastructure
completion
research and development
business
world
private seed producers
period from 8.3m in the last period
local community
RAIL
Palm Oil Sales Seed Sales Cattle Production Sugar sales
26
CPO being loaded at West New Britain, PNG CPO arrival storage tanks at New Britain Oils, UK
27
2012
London, Ms Jean Kekedo on 25th August 2010
production facility now commissioned
segregated and sustainable supply chain
traceable, sustainable palm oil direct from the plantation to the EU consumer
28
Grassland and pasture available for planting in the Ramu Valley, incredible expansion potential
29
2012
expansion area for NBPOL
positive outlook
group (2010: $21.4m)
Ramu Agri Industries Ltd (RAIL)
30
NBPOL facilities on New Britain, PNG
31
2012
50 100 150 200 250 RAMU Short term fjnancing - Liverpool refjnery KPOL facility
$m
300 350
Current Debt Position
32
Replanting programme in process on West New Britain, PNG
33
2012
earnings per NBPOL share
up to a fjve percent issue of NBPOL shares to enable this share acquisition
Other holdings 80% 20% 18.7% 81.3%
IPBC NIDC Poliamba Limited Poliamba Higaturu Milne Bay Kula Palm Oil Ltd (“KPOL”) Poliamba Higaturu Milne Bay Poliamba Limited Kula Palm Oil Ltd (“KPOL”)
Other holdings 100% 100% c.0.4% c.2%
IPBC NIDC
NBPOL Current Position Proposed Reorganisation
Other Shareholders
34
Kumbango mill carbon reduction methane capture project
35
2012
the industry, it has chosen to publish the fjrst detailed life cycle carbon emissions for palm oil
reporting as critical going forward and has again positioned itself as a leader
and represents a measurable, time bound commitment to CO2 reduction.
36
Social awareness, support, and interaction is vital in PNG, especially as NBPOL provides housing, healthcare, recreational facilities, and education to a large proportion of its approximate 11,500 permanent employees. NBPOL takes its responsibilities to its employees extremely seriously and recognises its obligations to the workforce which rely heavily on the company
37
2012
back to source
that are best showing how to grow profits at the same time as actively tackling environmental and social challenges
38
NBPOL newly planted estates
39
2012
40
are given by the Company or any person connected with the Company as to the fairness, accuracy or completeness of the information or opinions contained in this document, any presentation made in conjunction herewith or the accompanying materials and no liability is accepted in respect thereof, to the extent permitted by law.
subsidiary undertakings or affjliates or any of such person’s offjcers or employees, advisors or other representatives, accepts any liability whatsoever (whether in negligence or otherwise) arising directly or indirectly from the use of this document.
whole or in part, by any medium or in any form to any other person for any purpose without the Company’s prior written
all reasonable steps to preserve such confjdentiality. You shall not use this document or the information contained therein in any manner detrimental to the Company.
decision or action, by any person.
development may differ materially from those expressed or implied by these statements by a variety of factors.
February 2012
2012
www.nbpol.com.pg
Phone: +44 (0)20 7472 5936
2012