cpse etf further fund offer ffo
play

CPSE ETF Further Fund Offer (FFO) Managed by Reliance Nippon Life - PowerPoint PPT Presentation

CPSE ETF Further Fund Offer (FFO) Managed by Reliance Nippon Life Asset Management Limited (formerly Reliance Capital Asset Management Limited) (An Open-ended Index Exchange Traded Scheme) (Rajiv Gandhi Equity Savings Scheme (RGESS) Qualified


  1. CPSE ETF Further Fund Offer (FFO) Managed by Reliance Nippon Life Asset Management Limited (formerly Reliance Capital Asset Management Limited) (An Open-ended Index Exchange Traded Scheme) (Rajiv Gandhi Equity Savings Scheme (RGESS) Qualified Scheme) 
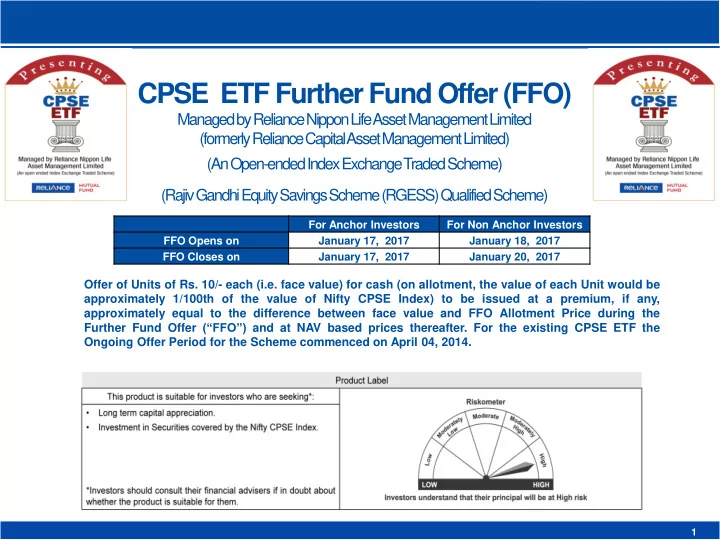
For Anchor Investors For Non Anchor Investors FFO Opens on January 17, 2017 January 18, 2017 FFO Closes on January 17, 2017 January 20, 2017 Offer of Units of Rs. 10/- each (i.e. face value) for cash (on allotment, the value of each Unit would be approximately 1/100th of the value of Nifty CPSE Index) to be issued at a premium, if any, approximately equal to the difference between face value and FFO Allotment Price during the Further Fund Offer (“FFO”) and at NAV based prices thereafter. For the existing CPSE ETF the Ongoing Offer Period for the Scheme commenced on April 04, 2014. Slide 1

  2. Table of Contents Introduction to Exchange Traded Funds (ETFs)  Development of International & Indian ETFs Market  Advantages of ETF  Nifty CPSE Index  CPSE ETF - Overview  CPSE ETF FFO  Slide 2

  3. Introduction to Exchange Traded Funds (ETFs) Slide 3

  4. Introduction to Exchange Traded Funds (ETFs) An Exchange Traded Fund (ETF) is primarily a mutual fund scheme which is listed and traded on a stock exchange. An ETF can invest in: Equities – replicating the composition and performance of an equity index (e.g.  Nifty 50 Index, Nifty Next 50 Index) Commodities – tracking the actual price of a commodity (e.g. Gold)  Money market instruments – which include short-term government securities  and call money Debt Instruments - Government securities with long maturity  Slide 4

  5. Development of International & Indian ETFs Market Slide 5

  6. Growth of ETFs Internationally 3500 5000 4500 3000 4000 AUM $ Billion No. of ETFs 2500 3500 3000 2000 2500 1500 2000 1500 1000 1000 500 500 0 0 Nov- 2000 2001 2002 2003 2004 2005 2006 2007 2008 2009 2010 2011 2012 2013 2014 2015 16 AUM* 74 105 142 212 310 416 579 806 716 1041 1313 1355 1754 2254 2643 2871 3287 No. of ETFs 94 208 283 288 334 440 719 1132 1614 1961 2473 3022 3334 3591 3966 4430 4791 • - AUM in USD Billion. Source: ETFGI Monthly Newsletter Nov 2016. Slide 6

  7. Growth of ETFs in India 35,000 65 30,000 55 AUM (Rs. in Crores) 25,000 45 No. of ETFs 20,000 35 15,000 25 10,000 15 5,000 5 0 -5 Dec- Dec- Dec- Dec- Dec- Dec- Nov- Dec-02 Dec-03 Dec-04 Dec-05 Dec-06 Dec-07 Dec-08 Dec-09 10* 11* 12* 13* 14* 15** 16** AUM 7 168 568 2920 7811 7142 2671 2410 4981 10852 13380 10959 12677 17622 31118 No of ETFs 1 5 6 6 6 12 16 18 26 33 34 39 45 57 63 Source : MFI Explorer *Average AUM for the Quarter. ** Month end AUM (For other periods AUM is Average AUM for Month). Slide 7

  8. Advantages of ETF Slide 8

  9. Familiar ground – best of both worlds Like a fund… Like a stock…     Constructed to track an index Trading flexibility intraday on the exchange  Open ended mutual fund  Real time price  Lower expense ratio generally as  compared to an active equity fund Put limit orders   Lower turnover Minimum trading lot is just 1 unit   More transparent Delivery into your Demat account Index fund Stocks ETF Slide 9

  10. Why invest via an ETF? Components of an index have more liquidity  Liquidity ETF liquidity enhanced via direct creation and redemption  Investors can generally see an ETF composition at any given time  Increased transparency Transaction and management cost  Continuous pricing on the exchange throughout market hours  Increased trading flexibility Minimum transaction size (1 unit)  Return potential Likely to capture market average return at low cost   Benefit from lower expense ratios due to lower portfolio management, Lower expenses trading and operational expenses Slide 10

  11. Nifty CPSE Index Slide 11

  12. Constituents of the Nifty CPSE Index GAIL (India) Slide 12 12

  13. About the Nifty CPSE Index Nifty CPSE Index is constructed in order to facilitate Government of India initiative to disinvest some of its stake in selected CPSEs (Central Public Sector Enterprises) through the ETF route. The index values are to be calculated on free float market capitalization methodology. The index has base date of 01-Jan-2009 and base value of 1000. Weights of index constituent shall be re-aligned (i.e. capped at 25%) every quarter effective 2 nd Monday of February, May, August and November. Selection Criteria: The 10 CPSE’s selected meet below mentioned parameters: Included in the list of CPSEs published by the Department of Public Enterprise  Listed at National Stock Exchange of India Ltd. (NSE)  Having more than 55% government holding (stake via Govt. of India or  President of India) under promoter category. Companies having average free float market capitalization of more than  Rs.1000 Cr. for six month period ending June 2013 are selected. Have paid dividend of not less than four per cent including bonus for the seven  years immediately preceding or for at least seven out of the eight or nine years immediately preceding are considered as eligible companies as on cut-off date i.e. 28-Jun-2013. Slide 13

  14. Nifty CPSE Index Vs Other Broad Indices - Valuations Index Name P/E Ratio P/B Ratio Dividend Yield (%) Nifty CPSE Index 11.44 2.00 4.07 Nifty 50 Index 21.93 3.10 1.35 Nifty Next 50 Index 25.14 3.29 1.69 Nifty 100 Index 22.4 3.13 1.4 Nifty 500 Index 25.3 2.82 1.32 Please note that the stock composition of all the indices are different Data as 30 th Dec 2016. Source : www.nseindia.com Slide 14

  15. CPSE ETF - Overview Slide 15

  16. CPSE ETF - Background Government of India (GOI) used innovative route to divest its holding in CPSEs  via ETF New Fund Offer (NFO) was first launched in March 2014  NFO received overwhelming response; NFO collection was Rs.4,363 Crs, out of  which Rs.1,363 Crs was refund to investors due to limited issue size of Rs.3,000 Crs Participation across various categories of investors  Units of CPSE ETF were listed on 04th April 2014 on NSE & BSE  Slide 16

  17. CPSE ETF – Scheme Details Investment objective  The investment objective of the Scheme is to provide returns that, before expenses, closely correspond to the total returns of the Securities as represented by the Nifty CPSE Index, by investing in the Securities which are constituents of the Nifty CPSE Index in the same proportion as in the Index. However the performance of the Scheme may differ from that of underlying index due to tracking error. There can be no assurance or guarantee that the investment objective of the Scheme would be achieved. Investment pattern  Indicative Allocation (% of net assets) Instruments Risk Profile Minimum Maximum Securities covered by Nifty CPSE Index 95% 100% Medium to High Money Market Instruments (with maturity not exceeding 91 0% 5% Low to Medium days), including CBLO, cash & cash equivalents. The above stated percentages are indicative and not absolute. Type of scheme  An Open Ended Index Scheme, listed on the Exchanges in the form of an Exchange Traded Fund (ETF) tracking Nifty CPSE Index RGESS  The Scheme is in compliance with the provisions of Rajiv Gandhi Equity Savings Scheme, 2013 (‘RGESS’) Slide 17

  18. CPSE ETF – Performance as on Dec 30, 2016 CPSE ETF (CPSEETF) NAV as on Dec 30, 2016: Rs 25.3145 NAV Per Unit TR: Nifty CPSE TR AB: Nifty 50 Period CPSE ETF B:Nifty CPSE Index (Rs.) Index# Index Dec 31, 2015 to Dec 30, 2016 21.5576 17.43 12.89 17.45 3.01 Dec 31, 2014 to Dec 31, 2015 25.1491 -14.28 -17.03 -14.48 -4.06 Dec 31, 2013 to Dec 31, 2014 -- -- -- -- -- Since Inception (March 28, 2014) CAGR (%) 17.4504 14.42 6.26 9.28 7.55 Point to Point (INR)* 14,507 11,826 12,780 12,225 *Based on current value of standard investment of Rs. 10,000 made at inception. Past performance may or may not be sustained in future and the same may not necessarily provide the basis for comparison with other investment. Since inception returns (wherever provided) is computed on Compounded Annualized Growth Returns (CAGR) basis. For Scheme(s) which has completed more than 3 years, point to point returns for twelve month periods for last 3 years is provided basis the last day of the calendar quarter and are computed on absolute basis. In case the scheme(s) which is in existence for more than 1 year but less than 3 years, point to point returns is provided for as many period as possible, such period being counted from the last day of the calendar quarter and are computed on absolute basis. Dividends (if any) are assumed to be reinvested at the prevailing NAV. Bonus (if any) declared has been adjusted. Performance of the scheme would be Net of Dividend distribution tax, if any. Face value of scheme is Rs. 10/- per unit. In case, the start/end date of the concerned period is non-business day (NBD), the NAV of the previous date is considered for computation of returns. B: Benchmark, AB: Additional Benchmark, #TR Index- Total Returns Index reflects the returns on the index arising from (a) constituent stock price movements and (b) dividend receipts from constituent index stocks, thereby showing a true picture of returns. For performance of other schemes managed by the fund manager please refer performance slides at the end Slide 18

Download Presentation
Download Policy: The content available on the website is offered to you 'AS IS' for your personal information and use only. It cannot be commercialized, licensed, or distributed on other websites without prior consent from the author. To download a presentation, simply click this link. If you encounter any difficulties during the download process, it's possible that the publisher has removed the file from their server.

Recommend


More recommend