
SLIDE 1
Course Business
l New datasets on CourseWeb for Week 5
l But first, we will finish last week’s math.csv
l Midterm assignment: Review a journal article in
your area that uses mixed-effects models
l Goals:
l Practice interpreting mixed-effects models l Springboard for class discussion of current practice &
reporting
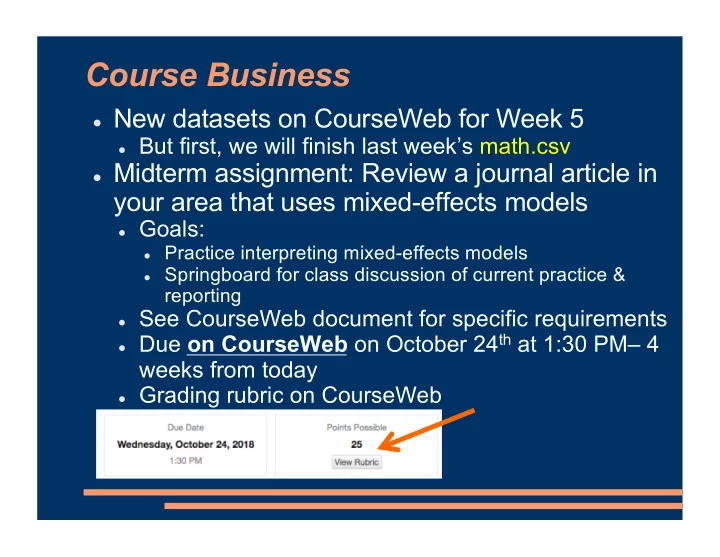
l See CourseWeb document for specific requirements l Due on CourseWeb on October 24th at 1:30 PM– 4
weeks from today
l Grading rubric on CourseWeb