
SLIDE 1
County-wide Stream Assessment
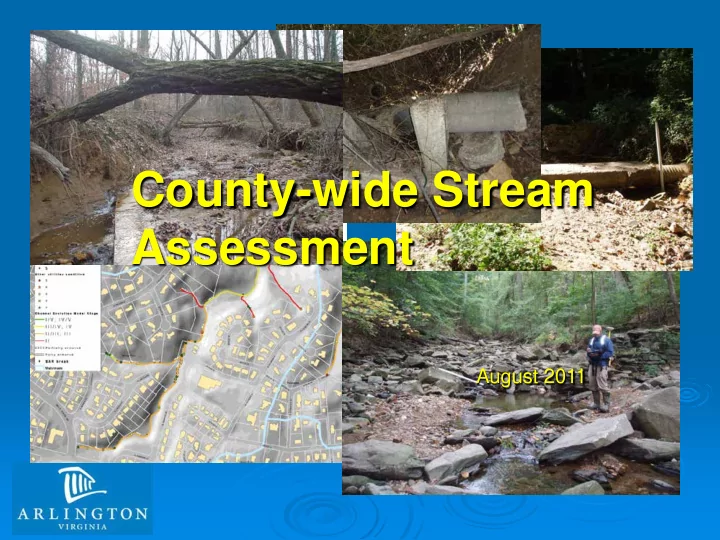
August 2011
County-wide Stream Assessment August 2011 Outline Arlington - - PowerPoint PPT Presentation
County-wide Stream Assessment August 2011 Outline Arlington Watershed Management Overview Stream inventory objectives and methods Results and Prioritization Next Steps Arlington Watershed Facts 2009 Census: 209,300 people
August 2011
Arlington Watershed Facts
streams
Impacts and limits from existing land use
Aging infrastructure System capacity Degraded water quality and stream
Tightening state and federal regulations Climate change
Implement urban housekeeping ‘best
Reduce flood risks Maintain stormwater infrastructure Require on-site stormwater controls for
Implement watershed retrofits Restore stream corridors Outreach and education Monitoring
Stormwater Master Plan (1996) and Watershed
l
l
l
Brustlin (VHB) Inc.
state, accounting for partial and full stabilization with concrete, rip-rap, etc.
Stream Assessment Reach (SAR) approach applied to establish stream reaches and characterize in-stream habitat and riparian buffer condition
conditions evaluated using the Center for Watershed Protection’s Unified Stream Assessment methodology
flow regime (e.g., perennial, ephemeral, etc.), and Cowardin wetland classification.
l
l
l
l
l
l
l
l
l
l
l
l
Stormwater outfall infrastructure – focus on
Utility infrastructure – focus on extent of pipe
Ranking system from 1 (good) to 5 (severe)
9.2 miles (34%) of stream in actively degrading channel condition
3.7 miles (40%) with some form of stabilization
10.4 miles (43%) in transition to equilibrium - can take decades
2.5 10% 0.2 1% 0.8 3% 2.6 11% 5.7 23% 6.6 27% 3.8 16% 2.3 9%
1/5 1/2 2 2/3 3 3/4 4 4/5
Miles of stream per category
Continue to erode their banks and beds, sending
Damage infrastructure, including sanitary
Are not safe for park users Undermine trees near the stream
Unrestored Donaldson Run Tributary with visibly higher sediment content Restored Donaldson Run Tributary with visibly lower sediment content
These watersheds have the most length of channel in CEM stages 2 and 3 and the least amount of stabilization measures in place for these reaches
63 1% 0% 1,370 24% 0% 2,863 50% 1,408 25% 0% 0%
Channel Evolution Model Stage
1/5 1/2 2 2/3 3 3/4 4 4/5
Linear feet of stream per category
4,233 linear feet (74%) of stream in actively degrading channel condition
Only 254 linear feet (6%) with some form of stabilization
1,408 linear feet (25%) in transition to equilibrium - can take decades
35 stormwater outfalls with severity score 4 or 5
1 287 70% 2 63 15% 3 27 6% 4 15 4% 5 20 5%
Stormwater Outfall Conditions County-wide
n=412
13 sanitary sewer lines with severity score 4 or 5 Data provided to DES Water/Sewer/Streets for evaluation
1 71 66% 2 13 12% 3 10 9% 4 8 8% 5 5 5%
Stream Valley Sanitary Sewer Conditions County-wide
n=107
66% of reaches in marginal or poor category
Qualitative evaluation of physical habitat elements to support aquatic organisms
45% of reaches in marginal or poor category
Qualitative evaluation of buffer composition (emphasis on canopy trees) and width
Optimal 8,240 6% Suboptimal 35,223 28% Marginal 48,657 39% Poor 33,453 27%
In-stream Habitat Conditions County-wide
Optimal 38,205 30% Suboptimal 30,902 25% Marginal 33,921 27% Poor 22,546 18%
Riparian Buffer Conditions County-wide
Prioritization at watershed scale Reaches in most actively degrading CEM categories (2, 2/3, and 3) without stabilization Outfalls in worst condition (4 and 5) Utilities in worst condition (4 and 5)
restoration projects
proximity to other priority reaches
Management Plan features and recommendations
under County drainage easement
projects