
SLIDE 1
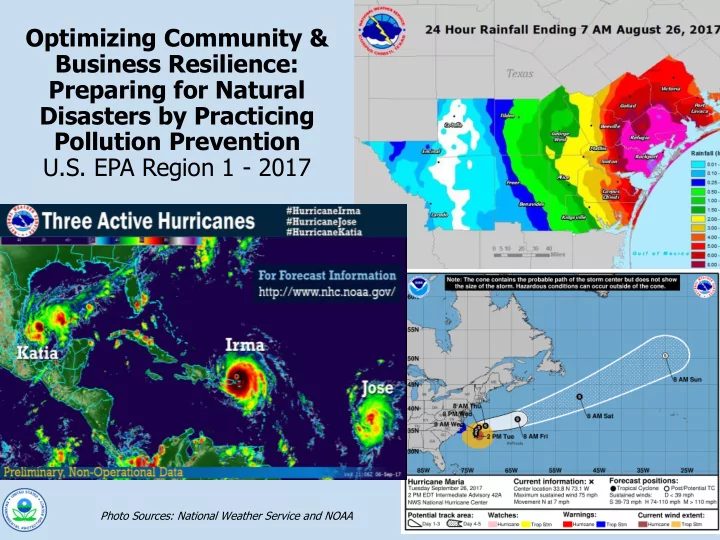
Optimizing Community & Business Resilience: Preparing for Natural Disasters by Practicing Pollution Prevention U.S. EPA Region 1 - 2017
Photo Sources: National Weather Service and NOAA
1
Pollution Prevention U.S. EPA Region 1 - 2017 Photo Sources: - - PowerPoint PPT Presentation
Optimizing Community & Business Resilience: Preparing for Natural Disasters by Practicing Pollution Prevention U.S. EPA Region 1 - 2017 Photo Sources: National Weather Service and NOAA 1 Flooding Events -- reminders of the ever-present
Photo Sources: National Weather Service and NOAA
1
2
3
4
By SHEILA KAPLAN and JACK HEALY SEPT. 11, 2017 – www.nytimes.com
5
6
7
8
9
10
Source: US Geological Survey Science Features, Featured Natural Hazards, Storm Surge Caused Major Damage During Hurricane Sandy, Battery Park Underpass New York City
11
Source: MyCoast.org. photo by Nancy Durfee, Scituate MA, 2/9/16
12
Cumulative Property Damage (1980-2015)
13
Source: National Oceanic and Atmospheric Administration. Storm Events Database. http://www.ncdc.noaa.gov/stormevents/
14
15
Source: New Hampshire Department of Environmental Services Green Yards Program, 2016
16
17
Pollution Prevention
18
Source: Massachusetts Office of Technical Assistance, Franklin Paint Case Study
19
20
21
22
23
Comply with Regulations
24
25
26
Source: Vermont Dept. of Environmental Conservation
Comply with Regulations
27
28
29
30
31
32
33
34
35