SLIDE 1
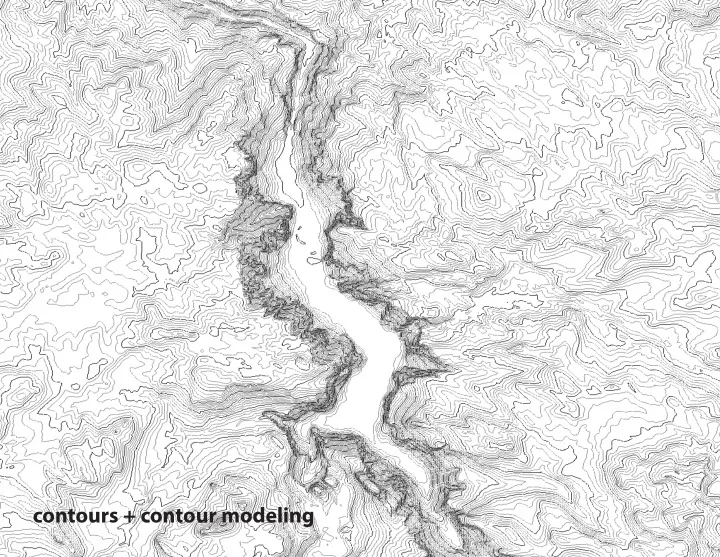
contours + contour modeling
SLIDE 2
SLIDE 3
Contour Line: A line drawn on a map or plan connecting points of equal elevation. Contour lines express surface modulation. Changing contours indicates a change of ground form.
SLIDE 4 Contour Line: A line drawn on a map or plan connecting points of equal elevation. Contour lines express surface modula-
- tion. Changing contours indicates a change of ground form.
Contour Interval: The change in elevation between one contour line and the next.
SLIDE 5 Contour Line: A line drawn on a map or plan connecting points of equal elevation. Contour lines express surface modula-
- tion. Changing contours indicates a change of ground form.
Contour Interval: The change in elevation between one contour line and the next. Spot Elevation: A point on a map or chart that has the elevation noted.
SLIDE 6 Contour Line: A line drawn on a map or plan connecting points of equal elevation. Contour lines express surface modula-
- tion. Changing contours indicates a change of ground form.
Contour Interval: The change in elevation between one contour line and the next. Spot Elevation: A point on a map or chart that has the elevation noted. Slope: The steepness, incline or grade of a line. A higher slope value indicates a steeper incline. Slope is defined by the rise
- ver the run or y/x values of two points on a line. Rise is equal to the change in height or ‘y’ direction while run is equal to the
change in length or ‘x’ direction.
SLIDE 7 Designing With Contours: Basic Definitions. spot elevation contour line contour interval = 1ft run: 1 inch rise: 53.2 - 50.4 slope = rise/run = 2.8/20 = .14 = 14% slope
scale 1 inch = 20 foot
SLIDE 8
Designing With Contours: Characteristics of Contour lines. All points on a contour line have the same elevation. Every contour closes on itself either within or beyond the limits of the map. If it closes beyond the limits of the map it will run to the map edge A contour which closes on itself within the limits of a map is either a summit or a depression. They can be distinguished by marked spot elevations at the low point (LP) or High point (HP). Contours which are equally spaced indicate a uniform sloping surface. Generally contours that are close together indicate a steep slope while contours spaced far apart indicate a shallow slope. On a convex slope the higher contours are spaced farther apart than the lower contours. On a concave slope contours the lower contours are spaced farther apart than the higher contours Valleys are indicated by contours pointing uphill. In crossing a valley with a stream at the bottom, the contours run up the valley on one side, turn at the stream and run back down the other side. Contours never split; however, occassionally you will see two contours numbered the same side by side. This indicates a high or low point. Water flows along slope perpendcular to the contour and along the shortest disctance between contour lines (steepest area) Contour lines are labeled with the elevation on the high side of the line.
SLIDE 9
SLIDE 10
SLIDE 11
SLIDE 12
contours do not split. incorrect correct
SLIDE 13 contours are always closed lines. incorrect correct
SLIDE 14 39 38 37 36
contours do not overlap. except in the case of an overhang
SLIDE 15 10 10 20 30 40 50 60 70 80 90 100 110 120
SLIDE 16 10 10 20 30 40 50 60 70 80 90 100 110 120
incorrect: contours do not meet existing contours at the site edge
SLIDE 17 10 10 20 30 40 50 60 70 80 90 100 110 120
SLIDE 18 10 10 20 30 40 50 60 70 80 90 100 110 120
SLIDE 19
SLIDE 20
SLIDE 21
Designing With Contours: Slope Slope indicates the steepness of a given surface and can be expressed as either a ratio or a percentage. The slope of a surface can dramatically alter the experiential and performative aspects of a surface. The slope of a given surface is an important factor in determining the program and material of that surface. Every material has an angle of repose, or slope at which it is resting at the steepest angle possible. At this angle the material is at the point between stability and sliding. The angle of repose is determined by the density, surface area, friction coefficient and shape of the material particles. Simple rules for slope requirements for various activities and materials can be found in “ Time-Saver Standards For Landscape Architecture” (Charles Harris and Nicolas Dines.)
SLIDE 22
SLIDE 23
ASSIGNMENT II_PART II Make a contour plan and model
SLIDE 24 Step 1_Make a contour plan of your model
1_BASE Create a 6” x 12” rectangle of your model in graphite on a sheet of 12”x18” vellum. 2_GRID Draw a 1” grid on your rectangle using a light graphite (H or 2H) using your t-square and triangle. Use your ruler (for a clay model) or a pencil lines (for a paper model) to demarcate the same grid on your model. 3_GRID ELEVATIONS Find elevations at grid intersection points. Your prior sections and push-pin tool will help you map these out. Write these in light graphite (H or 2H) as well. Give yourself a consistent numbering system, with your base being the lowest number (0). Your foamcore size should determine your contour interval (3/16” foamcore has 3’ contours, and 1/8” foamcore has 2’ contours). 4_SPOT ELEVATIONS Measure any spot elevations-- high or low points-- that do not intersect with your grid and locate them on your plan. NOTE: If your model is faceted, you should focus on fj nding these spot elevations rather than focusing
- n the grid. Locate the edges of major planes or terraces using your grid as a reference.
5_INTERPOLATE Using these elevations, interpolate where the contour lines should fall. Begin connecting points at similar heights. Reference the model to help you interpolate any curves or other forms on your
- model. Use your contour lines to clarify your form; for example, uniform slope on planes or facets will
have evenly spaced contours. If you are concerned about meeting a certain slope, use RISE divided by slope % to calculate the distance between contours. 7_LABEL Label all contours with elevaton (remember-- these will be in intervals of 2’ or 3’). By convention, contours are labeled on the high side.
SLIDE 25
spot elevation contour line contour interval = 1ft run: 1 inch rise: 53.2 - 50.4 slope = rise/run = 2.8/20 = .14 = 14% slope
SLIDE 26 Step 2_Make a foamcore contour model from your contour plan
1_TRACE Place a sheet of trace paper over your plan and outline the lowest elevation contour line(s). 2_REPEAT Repeat step 1 until you are done tracing the contour lines, making sure to label each contour with the elevation height. Do this with every contour at 3’ intervals ( 0, 3, 6, 9, etc). Each should be separated
- ut as a separate piece of trace.
3_CUT + TAPE Take all sheets of trace and cut on the line(s) but keep all pieces together that are on one sheet. Tape your trace paper contours to your foamcore, fi tting as many as possible on one piece to save material. 4_CUT FOAM + ASSEMBLE Begin cutting your pieces from the bottom elevation (0), placing pieces according to your plan on a 6” x 12” 1/2” foamcore base. Assemble your model and glue one layer at a time. Consult your plan and model if anything is unclear. Use foamcore techniques used previously-- use multiple passes and re place x-acto blades often. 5_ Admire the beautiful contour model you have just constructed.
SLIDE 27