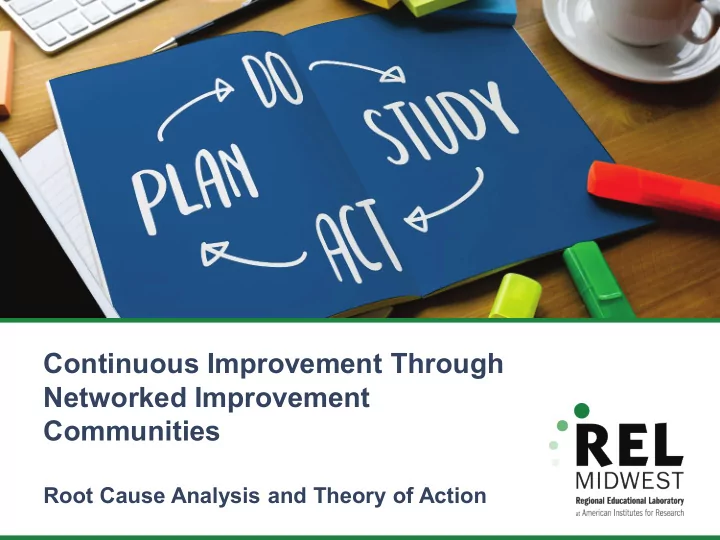
SLIDE 1 Continuous Improvement Through Networked Improvement Communities
Root Cause Analysis and Theory of Action
SLIDE 2 1. 2. 3. 4. 5.
Agenda
Welcome and Introductions Continuous Improvement Overview Root Cause Analysis Theory of Action Closing Remarks and Next Steps
SLIDE 3
Welcome and Introductions
SLIDE 4
SLIDE 5
Regional Educational Laboratories
SLIDE 6 Who does REL Midwest work with?
School districts, state education agencies, and other educational
- rganizations in Illinois, Indiana, Iowa,
Michigan, Minnesota, Ohio, and Wisconsin
SLIDE 7
What does REL Midwest do?
Applied research, technical assistance, and engagement activities to help partners understand research and evidence.
SLIDE 8
Why does REL Midwest do this work?
To solve practical problems and advance fundamental understandings of education challenges and processes.
SLIDE 9 How does REL Midwest do this work?
REL Midwest conducts its work through collaborative research partnerships with stakeholders in Illinois, Indiana, Iowa, Michigan, Minnesota, Ohio, and Wisconsin. To address the priorities and interests
- f these states, REL Midwest supports four
research alliances and a networked improvement community, as well as emergent partnerships.
SLIDE 10
Types of support REL Midwest offers
SLIDE 11 Partnerships
4 Research Alliances
Improve Teacher Preparation
Research Alliance
Research Alliance
Education Research Alliance 1 Networked Improvement Community
and Technology Networked Improvement Community
SLIDE 12
Continuous Improvement Overview
SLIDE 13
What is a networked improvement community?
SLIDE 14 Networked Improvement Community A networked improvement community is a collaborative research partnership that uses the principles of improvement science within a group of organizations to learn from promising practices developed in each context and how they may be adapted to
SLIDE 15
The Improvement Process
SLIDE 16
Why use a networked improvement community?
SLIDE 17
“Rather than asking whether an ‘intervention works,’ a network improvement community asks, ‘What works, when, for whom and under what sets of circumstances?’”
—Bryk, Gomez, Grunow, & LeMahieu, 2015
SLIDE 18
What does a networked improvement community do?
SLIDE 19
SLIDE 20 The PDSA cycle consists of four stages:
- 1. Identify specific areas of
need (Plan).
supports to address those needs (Do).
that occur (Study).
- 4. Refine the intervention
(Act).
NICs solve problems together through PDSA cycles.
SLIDE 21
Root Cause Analysis
SLIDE 22 Goals
- Identify specific and actionable problems.
- Determine the root causes of those
problems.
- Come to consensus on which problem to
address together.
SLIDE 23
SLIDE 24
Create a Focused Problem Statement
Activity 1
SLIDE 25 Brainstorm problems you have experienced related to integration of technology into instructional practice and student learning.
- This week
- This month
- This year
SLIDE 26
Share and Group Problems
SLIDE 27
Write Problem Statement
SLIDE 28
Build Consensus
SLIDE 29
Take a Break
See you in 15 minutes.
SLIDE 30
Unpack Root Causes
Activity 2
SLIDE 31
SLIDE 32
Present Root Causes
SLIDE 33
Review Root Cause Analysis
SLIDE 34
SLIDE 35
Fishbone Diagram [Add fishbone diagram from Activity 2 here]
SLIDE 36
Theory of Action
Activity 3
SLIDE 37 Logic Model “Logic models present a theory of action or change that drives the program or policy and makes explicit any assumptions about both the resources at the disposal of the program and the rationale behind the effort.”
(Shakman & Rodriguez, 2015)
SLIDE 38 Logic Model
- Brings detail to broad goals
- Helps identify gaps in program logic and
clarify assumptions
- Builds understanding and promotes
consensus
- Makes underlying beliefs explicit
- Helps clarify what is appropriate to evaluate
and when
- Summarizes complex programs for effective
communication
(Shakman & Rodriguez, 2015)
SLIDE 39 Types of Logic Models
- Theory approach
- Activities approach
- Outcomes approach
SLIDE 40
REL Midwest Logic Model
SLIDE 41
input?
- What is the
- utput?
- What is the
- utcome?
Example
SLIDE 42
Theory of Action Template
SLIDE 43 Focus on Outcomes
Who is the target? What is the desired change (action verb)? In what (outcome)? By when?
e.g., Teachers e.g., Increase e.g., Formative data use skills e.g., March 2016
SLIDE 44 Relate Activities to Outputs Develop a series of short, actionable If/Then statements that begin to connect activities to
IF ______________ THEN ____________
SLIDE 45 Focus on Inputs
- What resources are readily available?
- What additional resources or supports are
needed?
- Is access to these resources or inputs
realistic?
SLIDE 46 Review Theory of Action Does the theory of action:
- Address the intended outcomes?
- Include activities that are feasible for the
NIC to implement?
- Includes program outputs and outcomes
that are measurable?
SLIDE 47
Take a Break
See you in 15 minutes.
SLIDE 48
Measurable Aim Statement
Activity 4
SLIDE 49
Aim Statement An aim statement is a written and measurable description of the desired improvement.
SLIDE 50 Aim Statement The aim statements should include:
- A preset target population
- A metric of interest
- A change in a numerical value on the metric
- f interest
- A timeline on which the change should occur
SLIDE 51
Next Steps
SLIDE 52
Reflections
SLIDE 53 For the next session, think about the following questions:
- What metrics do you already
collect that can be used to track inputs, outputs, and outcomes in the theory of action?
- What metrics would you like to
use to collect and track inputs,
- utputs, and outcomes in the
theory of action?
SLIDE 54
IES Resources
SLIDE 55 Networked Improvement Communities
SLIDE 56
Logic Models
SLIDE 57 Bryk, A. S., Gomez, L. M., Grunow, A., & LeMahieu, P. G. (2015). Learning to improve: How America’s schools can get better at getting better. Cambridge, MA: Harvard Education Press. Shakman, K., & Rodriguez, S. M. (2015). Logic models for program design, implementation, and evaluation: Workshop toolkit (REL 2015–057). Washington, DC: U.S. Department of Education, Institute of Education Sciences, National Center for Education Evaluation and Regional Assistance, Regional Educational Laboratory Northeast & Islands. Retrieved from https://ies.ed.gov/ncee/edlabs/regions/northeast/pdf/REL_2015057.pdf