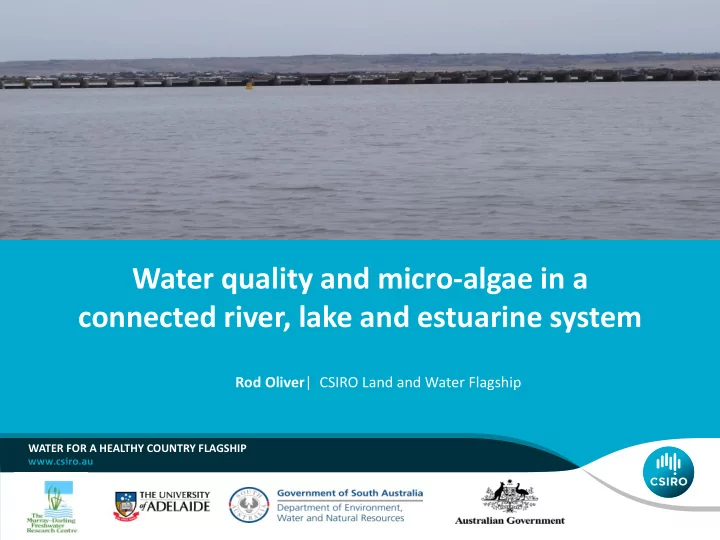

Water quality and micro-algae in a connected river, lake and estuarine system Rod Oliver | CSIRO Land and Water Flagship WATER FOR A HEALTHY COUNTRY FLAGSHIP
Water Quality Upland Catchments Floodplain Urban Estuarine and Marine Groundwater Sediments 2 | CLLMM Water Quality | Rod Oliver
Micro-algae 3 | CLLMM Water Quality | Rod Oliver
Simplified aquatic food web Respiratory Microbial Loop Respiratory Loss Internal material : External material balance 4 | CLLMM Water Quality | Rod Oliver
Water quality monitoring sampling locations 5 | CLLMM Water Quality | Rod Oliver
Water Quality Sampling Dates at different sites Lake Alexandrina: Milang - Dates Lake Alexandrina: Beacon 90=97 - Dates Coorong: Tauwitchere - Dates 150000 Turbidity 150000 Turbidity 150000 Turbidity Sulphate Sulphate Sulphate Silica Reactive Silica Reactive Silica Reactive Lock 1 Discharge [ML/Day] Lock 1 Discharge [ML/Day] Lock 1 Discharge [ML/Day] Phosphorus Total (as P) Phosphorus Total (as P) Phosphorus Total (as P) Phosphorus FRP (as P) Phosphorus FRP (as P) Phosphorus FRP (as P) 100000 100000 100000 pH pH pH Organic Carbon Dissolved Organic Carbon Dissolved Organic Carbon Dissolved Nitrogen Total (as N) Nitrogen Total (as N) Nitrogen Total (as N) Nitrogen TKN (as N) Nitrogen TKN (as N) Nitrogen TKN (as N) Nitrogen NOx (as N) Nitrogen NOx (as N) Nitrogen NOx (as N) 50000 50000 50000 Ammonia Nitrogen (as N) Ammonia Nitrogen (as N) Ammonia Nitrogen (as N) Iron Total Iron Total Iron Total Dissolved Solids Total Dissolved Solids Total Dissolved Solids Total Dissolved Oxygen Dissolved Oxygen Dissolved Oxygen Conductivity (25C) Conductivity (25C) Conductivity (25C) 0 0 0 Chlorophyll a Chlorophyll a Chlorophyll a 1980 1990 2000 2010 1980 1990 2000 2010 1980 1990 2000 2010 Lake Alexandrina: Middle - Dates Lake Albert: Meningie - Dates Coorong: Murray Mouth - Dates 150000 150000 150000 Turbidity Turbidity Turbidity Sulphate Sulphate Sulphate Silica Reactive Silica Reactive Silica Reactive Lock 1 Discharge [ML/Day] Lock 1 Discharge [ML/Day] Lock 1 Discharge [ML/Day] Phosphorus Total (as P) Phosphorus Total (as P) Phosphorus Total (as P) Phosphorus FRP (as P) Phosphorus FRP (as P) Phosphorus FRP (as P) 100000 100000 100000 pH pH pH Organic Carbon Dissolved Organic Carbon Dissolved Organic Carbon Dissolved Nitrogen Total (as N) Nitrogen Total (as N) Nitrogen Total (as N) Nitrogen TKN (as N) Nitrogen TKN (as N) Nitrogen TKN (as N) Nitrogen NOx (as N) Nitrogen NOx (as N) Nitrogen NOx (as N) 50000 50000 50000 Ammonia Nitrogen (as N) Ammonia Nitrogen (as N) Ammonia Nitrogen (as N) Iron Total Iron Total Iron Total Dissolved Solids Total Dissolved Solids Total Dissolved Solids Total Dissolved Oxygen Dissolved Oxygen Dissolved Oxygen Conductivity (25C) Conductivity (25C) Conductivity (25C) 0 Chlorophyll a 0 Chlorophyll a 0 Chlorophyll a 1980 1990 2000 2010 1980 1990 2000 2010 1980 1990 2000 2010 6 | CLLMM Water Quality | Rod Oliver
Microalgae Sampling Sites and Times 7 | CLLMM Water Quality | Rod Oliver
Microalgae time series for Lake Alexandrina Lake Alexandrina: Milang 150000 1e+06 100000 1e+04 cells/mL ML/Day 50000 1e+02 1e+00 0 1970 1975 1980 1985 1990 1995 2000 2005 2010 2015 Green algae Diatoms Blue-green algae 8 | CLLMM Water Quality | Rod Oliver
Murray River and Lake Alexandrina micro-algae MurrayR@TailemBend Lake Alexandrina: Milang 150000 150000 1e+06 1e+06 100000 100000 1e+04 1e+04 cells/mL cells/mL ML/Day ML/Day 50000 50000 1e+02 1e+02 1e+00 1e+00 0 0 1970 1975 1980 1985 1990 1995 2000 2005 2010 2015 1970 1975 1980 1985 1990 1995 2000 2005 2010 2015 Green algae Diatoms Blue-green algae 9 | CLLMM Water Quality | Rod Oliver
Salinity Lake Alexandrina: Milang 8000 150000 Conductivity (25C) 6000 100000 ML/Day µS/cm 4000 50000 2000 0 0 1970 1975 1980 1985 1990 1995 2000 2005 2010 2015 10 | CLLMM Water Quality | Rod Oliver
Time series: Cell numbers of 6 micro-algae over 11 field trips 10000 9000 8000 7000 Cells/ml 6000 5000 4000 3000 2000 1000 Series5 0 1 Series3 Algae type 2 3 4 5 6 Series1 7 8 9 10 11 Field Trip 11 | CLLMM Water Quality | Rod Oliver
Water quality characteristics in Lake Alexandrina Multivariate analyses 4 Dro Pre Dro Post 2 PC2 0 pH NOx Disch5 Conductivity Turbidity TN -2 TP -4 -4 -2 0 2 4 PC1 12 | CLLMM Water Quality | Rod Oliver
Microalgae communities in Lake Alexandrina: Multivariate analyses Transform: Square root Transform: Square root Resemblance: S17 Bray Curtis similarity (+d) Resemblance: S17 Bray Curtis similarity (+d) FYear Drought 2D Stress: 0.05 2D Stress: 0.12 1982/1983 1995/1996 Dro 1983/1984 1996/1997 Post Pre 1984/1985 1997/1998 1985/1986 2005/2006 1986/1987 2006/2007 1987/1988 2007/2008 1988/1989 2008/2009 Aphanizomenon 1989/1990 2009/2010 Planktolyngbya 1990/1991 2010/2011 Aphanocapsa 1991/1992 2011/2012 1992/1993 2012/2013 Planctonema 1993/1994 2013/2014 Scenedesmus 1994/1995 Pre-Drought: rank Drought: rank Post-Drought: rank Planctonema (green) Planctolyngbya (blue-green) Planctolyngbya (blue-green) Anabaena (blue-green) Aphanocapsa (blue-green) Aphanocapsa (blue-green) Nodularia (blue-green) Aphanizomenon (blue-green) Planctonema (green) Oocystis (green) Ankistrodesmus (green) Crucigenia (green) Dictyosphaerium (green) Pseudanabaena (blue-green) Oocystis (green) 13 | CLLMM Water Quality | Rod Oliver
Time series comparing water quality characteristics in Lake Albert with Lake Alexandrina 13/14 10/11 10/11 12/13 11/12 11/12 09/10 12/13 13/14 08/09 09/10 07/08 05/06 05/06 06/07 08/09 06/07 07/08 Lake Albert : Circles: Lake Alexandrina: Filled rectangles 14 | CLLMM Water Quality | Rod Oliver
WQ parameters correlated to microalgae changes Transform: Square root Resemblance: S17 Bray Curtis similarity (+d) Drought 2D Stress: 0.12 Dro Post Pre Conductivity TN Disch5 15 | CLLMM Water Quality | Rod Oliver
Environmental Limits for Management • Multivariate analyses of the water quality and microalgae across CLLMM regions will improve our understanding of characteristic environmental conditions helping set management triggers and limits of acceptable change. 16 | CLLMM Water Quality | Rod Oliver
Thank you Division/Unit Name Division/Unit Name Presenter Name Presenter Name Presenter Title Presenter Title t +61 2 9123 4567 t +61 2 9123 4567 e firstname.surname@csiro.au e firstname.surname@csiro.au w www.csiro.au/lorem w www.csiro.au/lorem ADD BUSINESS UNIT/FLAGSHIP NAME
Recommend
More recommend