
SLIDE 1
Office of the Vice President for Research
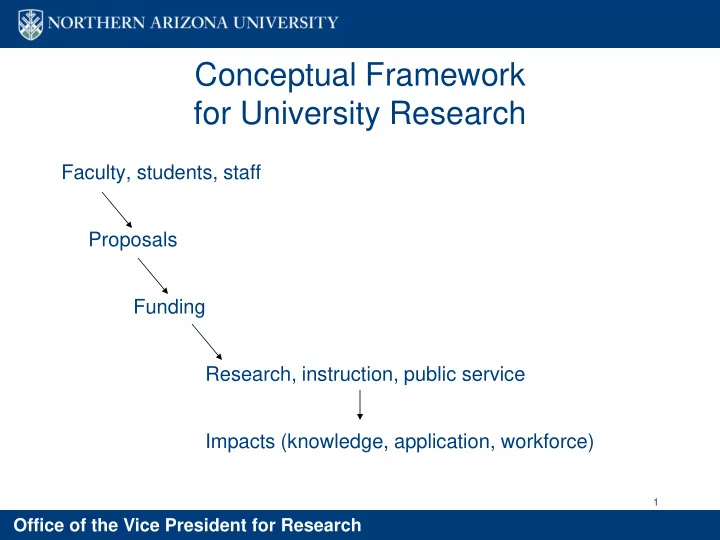
Conceptual Framework for University Research
Faculty, students, staff Proposals Funding Research, instruction, public service Impacts (knowledge, application, workforce)
1
Conceptual Framework for University Research Faculty, students, - - PowerPoint PPT Presentation
Conceptual Framework for University Research Faculty, students, staff Proposals Funding Research, instruction, public service Impacts (knowledge, application, workforce) 1 Office of the Vice President for Research Sponsored Projects
1
100 200 300 400 500 600 700 1997 1998 1999 2000 2001 2002 2003 2004 2005 2006 2007
Fiscal Year Number
Proposals submitted Funded
2
10 20 30 40 50 60 70 80 90 1997 1998 1999 2000 2001 2002 2003 2004 2005 2006 2007 Fiscal Year Dollars (in Millions) Amount $ Requested
3
Sponsored Project Awards by Activity
42% 40% 18% Research Public Service Instruct/Academic
Sponsored Project Funding by Source
10 20 30 40 50 2005 2006 2007 Dollars (in millions) Industry Intl Nonprofit Coll Univ Private Local gov State gov Federal
4
5
Sponsored Project Awards by Activity
42% 40% 18% Research Public Service Instruct/Academic
Sponsored Project Funding by Source
10 20 30 40 50 2005 2006 2007 Dollars (in millions) Industry Intl Nonprofit Coll Univ Private Local gov State gov Federal
Examples:
Az State Parks, USFS – low ICR rates
Institute for Tribal Environmental Professionals – high proportion of Service projects
6
7
8
9
10