
CONCEPTUAL MODEL
Research Planning Workshop
Conceptual model
A descriptive model or diagram that shows the
key elements in the system of interest and the hypothesized relationships between them.
Why make a conceptual model?
Clarifies what is known and not known about
the system.
Goes beyond simple cause and effect to
explore linkages and feedbacks in complex systems
Key for: Developing research hypotheses Identifying variables to study Interpreting research results Essential for integrated interdisciplinary
research
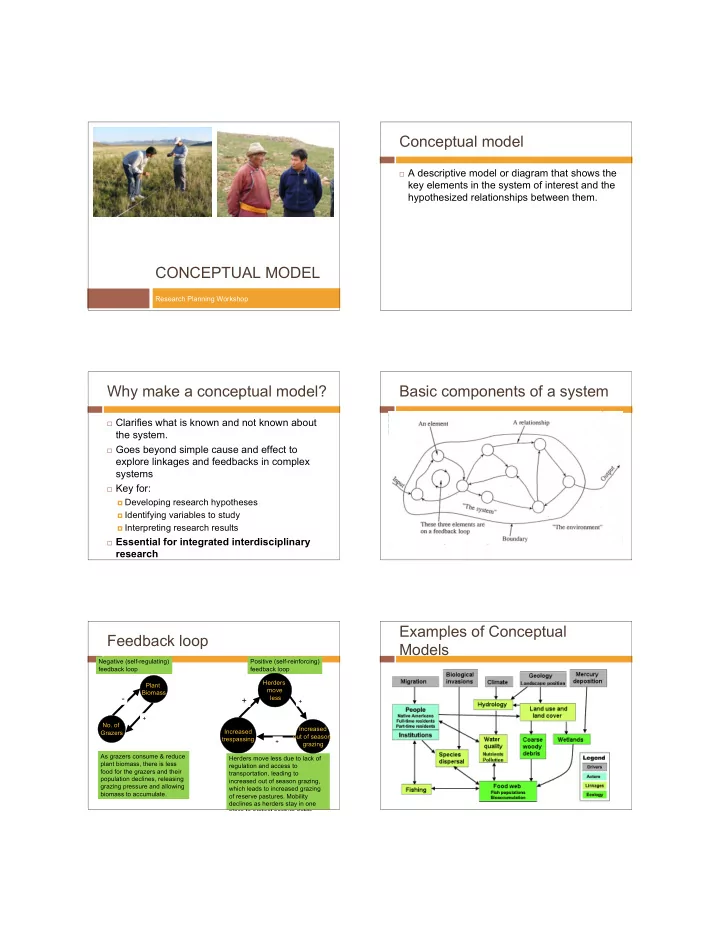
Basic components of a system Feedback loop
- No. of
Grazers Plant Biomass As grazers consume & reduce plant biomass, there is less food for the grazers and their population declines, releasing grazing pressure and allowing biomass to accumulate. Negative (self-regulating) feedback loop Positive (self-reinforcing) feedback loop
- +
Increased trespassing Herders move less
+
+ Herders move less due to lack of regulation and access to transportation, leading to increased out of season grazing, which leads to increased grazing
- f reserve pastures. Mobility
declines as herders stay in one place to protect pasture rights. Increased
- ut of season
grazing +