
SLIDE 1
Comprehensive Molecular Characterization Papillary Renal Cell - - PowerPoint PPT Presentation
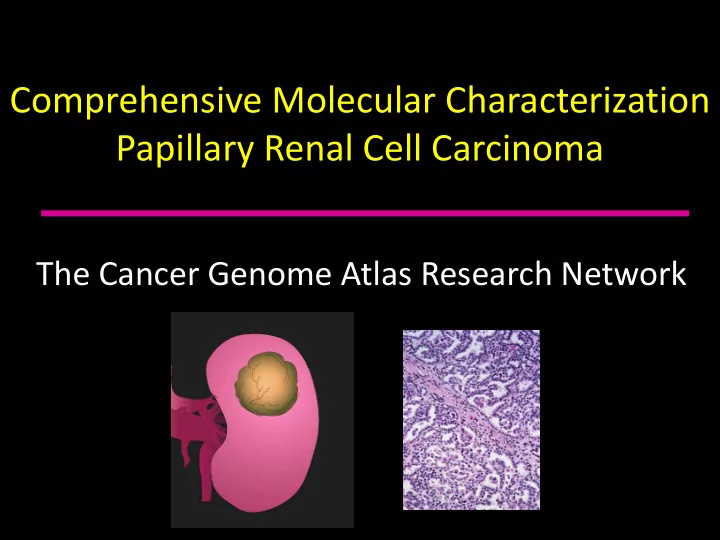
Comprehensive Molecular Characterization Papillary Renal Cell Carcinoma The Cancer Genome Atlas Research Network Renal Cell Carcinoma Clear Cell Papillary Type 1 Chromophobe Hybrid Oncocytoma Papillary Type 2 TFE3 Angiomyolipoma
Clear Cell Papillary Type 1 Papillary Type 2 Chromophobe Oncocytoma Angiomyolipoma TFE3 Oncocytic Clear/Chromophobe Hybrid
codon 1149 (exon 17) codons 1206, 1213 (exon 18) codons 1238, 1246, 1248, 1268 (exon 19)
codon 1112, 1110, 1124 (exon 16)
codon 1149 (exon 17) codons 1206, 1213 (exon 18) codons 1238, 1246, 1248, 1268 (exon 19) codon 1112, 1110, 1124 (exon 16)
OAA Citrate Isocitrate α-Ketoglutarate Succinyl-CoA Succinate Fumarate L-Malate
Acetyl-CoA CO2 MDH succinate succinate thiokinase α-KGDH H2O aconitase IDH citrate synthase
FH catalyzes the conversion
to malate Tomlinson, et al. Nature Genetics:30 2002
fumarate hydratase fumarate hydratase dehydrogenase
Analysis Type Method of Analysis Samples Analysed Copy Number Analysis SNP6.0 Arrays 161 PRCC Samples 161 Normals Somatic Mutation Analysis Exome Sequencing 157 PRCC Samples 157 Normals Methylation Analysis Illumina BeadChip Assays 161 PRCC Samples 45 Normals mRNA Expression Analysis RNA-Seq 161 PRCC Samples 30 Normals miRNA Expression Analysis RNA-Seq 161 PRCC Samples 32 Normals Protein Expression Analysis Reverse phase protein array (RPPA) 125 PRCC Samples
TCGA-BQ-5886 Unclassified PRCC N=26 TCGA-BQ-5878 Type 2 PRCC N=60 TCGA-A4-7732 Type 1 PRCC N=75
Cluster 2
Common amplification of chromosome 7. Additional amplifications of chromosomes 3, 12, 16 & 17.
Cluster 1
Genome Stable Small numbers of gains/losses
Cluster 3
Genome Unstable Numerous deletions, including chromosome 9.
100% 80% 60% 40% 0% 20% Survival Rate Time (days)
5000 4000 3000 2000 1000
Cluster 3 Cluster 2 Cluster 1
6000
performed using the MutSig 2.0CV with q-values <0.1
performed to evaluate genes identified in PanCan21.
such as the Hippo pathway and several chromatin modifier pathways.
MET
were in the tyrosine kinase domain, and were found predominately in the Type 1 PRCC.
somatic; 3 were germline.
MET
identified in 8 samples, resulting in the loss of the first two exons and gain of a novel exon.
deleted region of chromosome 9p containing the CDKN2A (p16) gene.
patients in their 7th and 8th decade.
with novel fusion partners, RBM10 and DVL2.
methylation patterns separated samples into 3 clusters
the CpG Island Methylator Phenotype (CIMP).
samples were Type 2 PRCC.
associated with somatic and germline FH mutation, low FH expression
Glycolysis and Fatty Acid Synthesis AMPK and Krebs Cycle
CIMP C1 C2b
COCA Clusters
demonstrated significantly increased levels of pRB & cell cycle related genes.