SLIDE 1
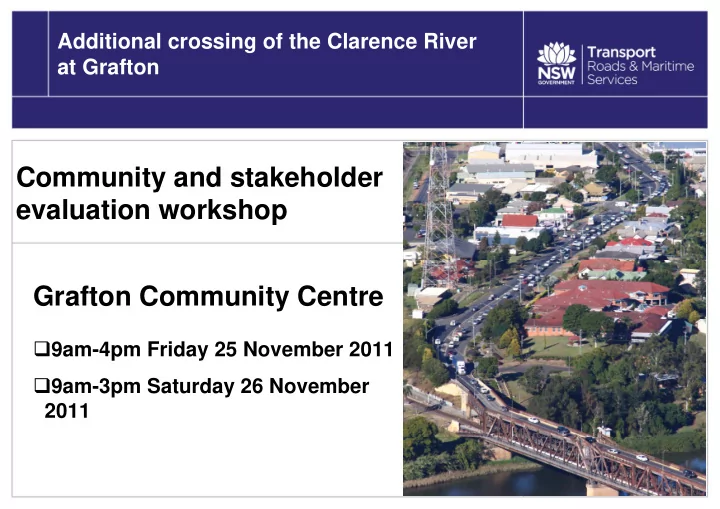
Community and stakeholder evaluation workshop Grafton Community Centre
9am-4pm Friday 25 November 2011 9am-3pm Saturday 26 November 2011
Additional crossing of the Clarence River at Grafton
SLIDE 2
Welcome and introduction
Welcome by Bob Higgins (BH) Where are we now? (BH) Short-listing process (BH) Purpose of this workshop (BH)
SLIDE 3
Welcome and introduction
Administration (DW) Agenda and breaks (DW) Pre-reading and workshop materials (DW) Role of project team and facilitator (DW)
SLIDE 4 Community participants and stakeholder representatives Community participants (DW)
- Susan Hillery
- Matthew Pope
- David Graham
- Richard Green
- Greg Hayes
- Kim Dahl
- Neil Jameson
- Jayne Miller
- No nominations were received from Clarenza
SLIDE 5 Community participants and stakeholder representatives Stakeholder representatives (DW)
- David Morrison (Clarence Valley Council)
- Tim Jenkins (Clarence Valley Council)
- Jenny Johnson (Dept of Planning and Infrastructure)
- Phil Belletty (Grafton Chamber of Commerce and Industry)
- Brett Duroux (Grafton-Ngerrie LALC)
- Robert Blanchard (freight transport industry)
- Chris Webb (public transport industry)
- Representatives from the Local Emergency Management Committee
and the Clarence Environment Centre were not available to attend
- A representative from the Summerland Way Promotional Committee
declined the invitation to attend
SLIDE 6
Community involvement and feedback
Information and feedback sessions (DW) Community feedback received on the Preliminary Route Options Report – Parts 1&2
(DW)
SLIDE 7
Workshop objectives and anticipated outcomes
Workshop objectives (CC)
Gain a shared understanding of which options
provide the best balance across social, environmental, economic, engineering and cost issues
Anticipated outcomes (CC)
Identify the “best” option or options within each of
the five corridors
Identify and record any issues or comments
SLIDE 8
Project purpose
The project purpose is to identify an additional crossing of the Clarence River at Grafton to address short-term and long-term transport needs.
SLIDE 9 Project objectives Enhance road safety for all road users over the length of the project Improve traffic efficiency between and within Grafton and South Grafton Provide value for money Minimise impact on the environment Support regional and local economic development Involve all stakeholders and consider their interests
- Not used for assessment – considered a process
- bjective and includes community involvement
SLIDE 10 Supporting objectives and indicators
The Supporting Objectives provide more detail
The Indicators provide an indication of how each option performs in achieving the objectives
SLIDE 11 Process to rank options within each corridor 5 step process to rank options within each corridor (CC): Step 1 - Review the results for each indicator. Step 2 - For each supporting objective, score each
10 is awarded to the best option in the corridor, and The other options are scored relative to the best option.
SLIDE 12
Scoring of options
Performance compared to other options in the corridor Suggested score Best option within a corridor: 10 / 10 Performs marginally worse than the best option in that corridor: 9 / 10 Performs a little/somewhat worse than the best option: 7–8 / 10 Performs substantially worse than the best option: 5 / 10 Performs very poorly compared to the best option: 2–3 / 10 Performs extremely poorly compared to the best option: 0 / 10
SLIDE 13 Process to rank options within each corridor Step 3 - For each project objective, consider the scores for all the supporting objectives, then rank the
Step 4 - For each corridor, review the rankings for the project objectives and agree (where possible) on final
Step 5 - Review final option rankings and agree on the best option(s) in that corridor.
SLIDE 14 Community and Stakeholder Evaluation Workshop
SUPPORTING OBJECTIVE INDICATORS CORRIDOR XX Indicator Option X Option Y Option Z Comments PROJECT OBJECTIVE 1 Supporting objective 1 Indicator 1 10 5 7 Indicator 2 43 28 55 Indicator 3 2 7 3 SCORE for supporting objective 1 Supporting objective 2 Indicator 4 1 1 1 Indicator 5 3 4 8 SCORE for supporting objective 2 RANK FOR PROJECT OBJECTIVE 1 RANK FOR PROJECT OBJECTIVE 2 RANK FOR PROJECT OBJECTIVE 3 RANK FOR PROJECT OBJECTIVE 4 RANK FOR PROJECT OBJECTIVE 5
OVERALL RANK FOR CORRIDOR XX
Step 1 - Review the results for each indicator
Comments recorded
SLIDE 15 Community and Stakeholder Evaluation Workshop
SUPPORTING OBJECTIVE INDICATORS CORRIDOR XX Indicator Option X Option Y Option Z Comments PROJECT OBJECTIVE 1 Supporting objective 1 Indicator 1 10 5 7 Indicator 2 43 28 55 Indicator 3 2 7 3 SCORE for supporting objective 1 A B C Supporting objective 2 Indicator 4 1 1 1 Indicator 5 3 4 8 SCORE for supporting objective 2 RANK FOR PROJECT OBJECTIVE 1 RANK FOR PROJECT OBJECTIVE 2 RANK FOR PROJECT OBJECTIVE 3 RANK FOR PROJECT OBJECTIVE 4 RANK FOR PROJECT OBJECTIVE 5
OVERALL RANK FOR CORRIDOR XX
Step 2 – For each supporting
each option out
Comments recorded
SLIDE 16 Community and Stakeholder Evaluation Workshop
SUPPORTING OBJECTIVE INDICATORS CORRIDOR XX Indicator Option X Option Y Option Z Comments PROJECT OBJECTIVE 1 Supporting objective 1 Indicator 1 10 5 7 Indicator 2 43 28 55 Indicator 3 2 7 3 SCORE for supporting objective 1 A B C Supporting objective 2 Indicator 4 1 1 1 Indicator 5 3 4 8 SCORE for supporting objective 2 E F G RANK FOR PROJECT OBJECTIVE 1
2 3 1
RANK FOR PROJECT OBJECTIVE 2 RANK FOR PROJECT OBJECTIVE 3 RANK FOR PROJECT OBJECTIVE 4 RANK FOR PROJECT OBJECTIVE 5
OVERALL RANK FOR CORRIDOR XX
Step 3 – For each project
the options in that corridor
Comments recorded
SLIDE 17 Community and Stakeholder Evaluation Workshop
SUPPORTING OBJECTIVE INDICATORS CORRIDOR XX Indicator Option X Option Y Option Z Comments PROJECT OBJECTIVE 1 Supporting objective 1 Indicator 1 10 5 7 Indicator 2 43 28 55 Indicator 3 2 7 3 SCORE for supporting objective 1 A B C Supporting objective 2 Indicator 4 1 1 1 Indicator 5 3 4 8 SCORE for supporting objective 2 E F G RANK FOR PROJECT OBJECTIVE 1
2 3 1
RANK FOR PROJECT OBJECTIVE 2
1 2 3
RANK FOR PROJECT OBJECTIVE 3
2 3 1
RANK FOR PROJECT OBJECTIVE 4
3 1 2
RANK FOR PROJECT OBJECTIVE 5
1 2 3
OVERALL RANK FOR CORRIDOR XX
1 2 3 Step 4 – For each corridor, review the rankings for the project
agree on final
Comments recorded
SLIDE 18 Community and Stakeholder Evaluation Workshop
SUPPORTING OBJECTIVE INDICATORS CORRIDOR XX Indicator Option X Option Y Option Z Comments PROJECT OBJECTIVE 1 Supporting objective 1 Indicator 1 10 5 7 Indicator 2 43 28 55 Indicator 3 2 7 3 SCORE for supporting objective 1 A B C Supporting objective 2 Indicator 4 1 1 1 Indicator 5 3 4 8 SCORE for supporting objective 2 E F G RANK FOR PROJECT OBJECTIVE 1
2 3 1
RANK FOR PROJECT OBJECTIVE 2
1 2 3
RANK FOR PROJECT OBJECTIVE 3
2 3 1
RANK FOR PROJECT OBJECTIVE 4
3 1 2
RANK FOR PROJECT OBJECTIVE 5
1 2 3
OVERALL RANK FOR CORRIDOR XX
1 2 3 Step 5 – Review final option rankings and agree on the best option(s) in that corridor
Comments recorded
SLIDE 19
Issues and constraints for each corridor
Environment (CC):
Residential amenity Heritage: Aboriginal Non-Aboriginal heritage Natural environment (native plants and animals) Aesthetics Flooding Social environment
SLIDE 20
Issues and constraints for each corridor
Road safety Traffic and transport efficiency Regional and local economic development Value for money More detail to follow during evaluation process
SLIDE 21
Evaluation of options
SLIDE 22
Corridor 1
SLIDE 23
Corridor 4
Corridor 4
SLIDE 24
Corridor 5
Corridor 5
SLIDE 25
Corridor 2
Corridor 2
SLIDE 26
Corridor 3
Corridor 3