
SLIDE 1
Communicating Storm Surge: Lessons Communicating Storm Surge: - - PowerPoint PPT Presentation
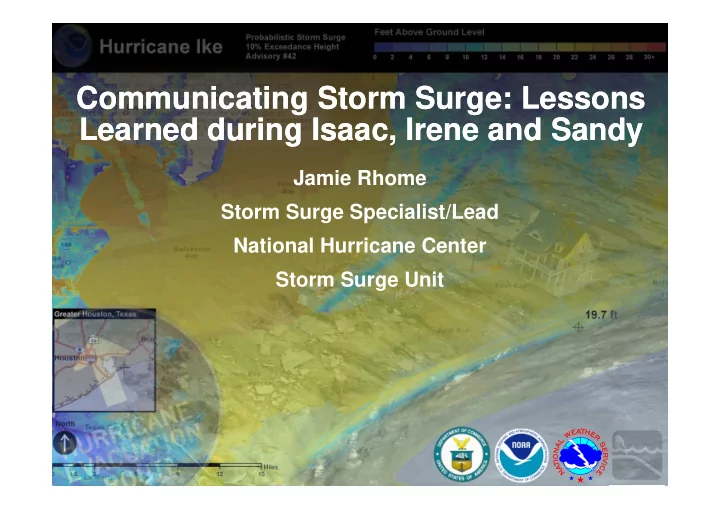
Communicating Storm Surge: Lessons Communicating Storm Surge: Lessons Learned during Isaac, Irene and Sandy Learned during Isaac, Irene and Sandy Jamie Rhome Storm Surge Specialist/Lead National Hurricane Center Storm Surge Unit The Surge
forecasts during tropical cyclone events
preparedness and resiliency through storm surge vulnerability and risk analysis
zones and planning
and education
is absolutely critical for the proper response
model guidance and official forecast
cause considerable variation in forecast information
Zone B remains dry when tide on correct vertical datum added
Zone B becomes wet when tide on incorrect vertical datum added
properly account for forecast uncertainty
numerical instability or haven’t been properly vetted for
lack of forecaster familiarity
COASTAL STORM SURGE FLOODING OF UP TO 20 FEET...WITH A FEW SPOTS TO NEAR 25 FEET...ABOVE NORMAL TIDES ALONG WITH LARGE AND DANGEROUS BATTERING WAVES...CAN BE EXPECTED NEAR AND TO THE EAST OF WHERE THE CENTER OF IKE MAKES LANDFALL. THE SURGE EXTENDS A GREATER THAN USUAL DISTANCE FROM THE CENTER DUE TO THE LARGE SIZE OF THE
ALREADY RISEN BY MORE THAN 5 FEET ALONG MUCH OF THE NORTHWESTERN GULF COAST. Same language and dissemination vehicle (text) as was used over 50 years ago!
include all contributions to total water level rise
anomaly
land (inundation) above ground level (AGL)
Interviews Lee County, FL Citizens Emergency Mangers National Weather Service FEMA Discussion s Emergency Managers National Weather Service Interviews Television Booths, Exhibits, Polling Emergency Mangers Television Citizens 6 Surveys Emergency Managers Television National Weather Service Public 18 Focus Groups Emergency Mangers Television National Weather Service Community Groups Product Review Emergency Managers Television 2 Focus Groups Community Members
deterministic information
probabilistic guidance
probabilistic guidance
initialized via an initial water level
still under research and development
increased versatility
Assess Public Need
Phase 1 (TC) and Phase 2 (ET) Lazo & Morrow: interviews, focus groups, public surveys
NOS/CSP
Assess Partner Needs
Phase 3 Lazo & Morrow: media web interviews and online survey
NOS/CSP & CSDL
Decision Support for EMs
WxEM – Tropical use case in NC RENCI, UNC-CH, ECU: multiple methods to assess EMs
NWS/OST
Product Prototyping and Evaluation
Phase 4 (TC): Inundation graphic, Storm Surge watch/warning ERG: prototype evaluations via interviews, focus groups, public surveys
NWS/HFIP
Experimental Products
Inundation graphic, storm surge watch/warning
Operational Products
inundation graphic, storm surge watch/warning
Irene¥Sandy Service Assessment UCAR Community Advisory Committee
NWS/NCEP NWS/NCEP
Marketing and Outreach
Integrating new products
NOS/CSC
labels, thresholds, wording – was tested extensively by social scientists with focus groups
tropical cyclone inundation graphic in 2014
inundation graphic
Guidance
Geoprocessing
between the National Hurricane Center and local forecast offices to issue tropical cyclone storm surge watches and warnings
consistency across all dissemination platforms and offices
surge watches and warnings in 2015
storms (2016/2017)
surge challenges
causes confusion
Date Action Status
Apr 2013 Storm Surge Inundation Graphic approved by Social Scientists Complete Feb 2014 New HLS/TCV examples approved by social scientists In Progress May 2014 Develop HLS/TCV requirements On Track Jun 2014 Implement P-Surge 2.0 On Track Jun 2014 Implement experimental tropical inundation graphic On Track Jul 2014 Issue Public Information Statement (PNS) announcing experimental test of new TCV On Track Aug - Nov 2014 OT&E of experimental TCV at Operations Proving Ground On Track Jun 2015 Implement experimental tropical Storm Surge Watch & Warning On Track Jun 2015 Implement operational WFO TCV & updated HLS On Track Jun 2015 Implement operational TCIG – approved by social scientists On Track Jun 2016 Implement interactive tropical cyclone web portal On Track 2016/2017 Implement operational tropical Storm Surge Watch/Warning and inundation graphic On Track
20 feet of storm surge above ground? 20 feet of storm surge above mean sea level? What is mean sea level?
above a vertical datum
which storm surge heights are referred