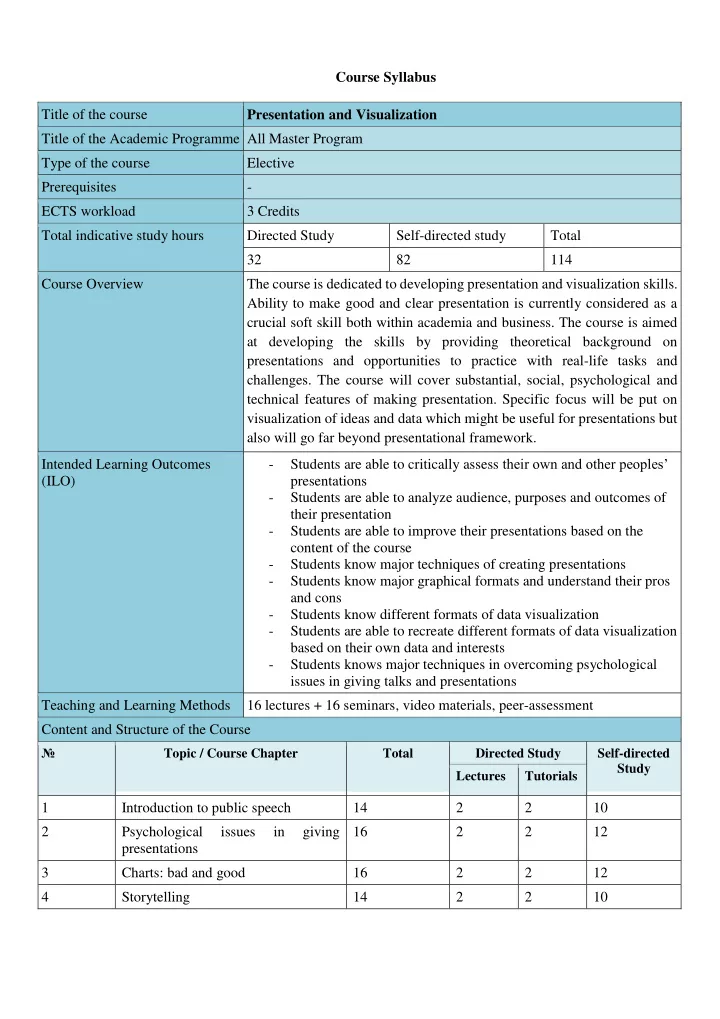
SLIDE 1 Course Syllabus Title of the course Presentation and Visualization Title of the Academic Programme All Master Program Type of the course Elective Prerequisites
3 Credits Total indicative study hours Directed Study Self-directed study Total 32 82 114 Course Overview The course is dedicated to developing presentation and visualization skills. Ability to make good and clear presentation is currently considered as a crucial soft skill both within academia and business. The course is aimed at developing the skills by providing theoretical background on presentations and opportunities to practice with real-life tasks and
- challenges. The course will cover substantial, social, psychological and
technical features of making presentation. Specific focus will be put on visualization of ideas and data which might be useful for presentations but also will go far beyond presentational framework. Intended Learning Outcomes (ILO)
- Students are able to critically assess their own and other peoples’
presentations
- Students are able to analyze audience, purposes and outcomes of
their presentation
- Students are able to improve their presentations based on the
content of the course
- Students know major techniques of creating presentations
- Students know major graphical formats and understand their pros
and cons
- Students know different formats of data visualization
- Students are able to recreate different formats of data visualization
based on their own data and interests
- Students knows major techniques in overcoming psychological
issues in giving talks and presentations Teaching and Learning Methods 16 lectures + 16 seminars, video materials, peer-assessment Content and Structure of the Course
№ Topic / Course Chapter Total Directed Study Self-directed Study Lectures Tutorials
1 Introduction to public speech 14 2 2 10 2 Psychological issues in giving presentations 16 2 2 12 3 Charts: bad and good 16 2 2 12 4 Storytelling 14 2 2 10
SLIDE 2 5 Technical details of graphics and fonts 14 2 2 10 6 Presentation software: powerpoint, prezi, latex 14 2 2 10 7 Place, time, audience 14 2 2 10 8 Popular science: how to deliver your research to general audience 14 2 2 10
Total study hours
114 16 16 82 Indicative Assessment Methods and Strategy The final grade will be based on participation in-class discussions (20%); home-tasks (40%); in-class assignments (10%) and final exam (30%). In-class discussions will be evaluated during seminars based on students’ activity and substantial contribution to the class. Home-tasks: Critical essay on one TED talk Improvement of a bad slide Short presentations applying specific techniques covered during the course (1 per student during the whole course) In-class assignments: A set of short quizzes to assess students’ knowledge of courses’ main concepts. Exam: Final presentation on the research topic of interest with written comments on selected techniques. Readings / Indicative Learning Resources Mandatory Duarte, N., & Sanchez, P. (2016). Illuminate: Ignite Change Through Speeches, Stories, Ceremonies, and Symbols. Penguin. Tufte, E., & Graves-Morris, P. (2014). The visual display of quantitative information.; 1983. Optional Duarte N. Slide: ology: The art and science of creating great
- presentations. – Sebastopol, CA : O'Reilly Media, 2008. – С. 417-421.
Duarte N. Resonate: Present visual stories that transform audiences. – John Wiley & Sons, 2013. Kapterev A. Presentation secrets: Do what you never thought possible with your presentations. – John Wiley & Sons, 2011. – Т. 152. Simmons A. The story factor: Inspiration, influence, and persuasion through the art of storytelling. – Basic books, 2006. Weissman, J. (2008). Presenting to win: the art of telling your story. FT Press. Wilkinson L. The grammar of graphics. – Springer Science & Business Media, 2006. Zelazny G. Say it with charts. – McGraw-Hill Professional Publishing, 2001. Indicative Self- Study Strategies Type +/– Hours Reading for seminars / tutorials (lecture materials, mandatory and optional resources) + 20
SLIDE 3 Assignments for seminars / tutorials / labs + 20 E-learning / distance learning (MOOC / LMS)
+ 22 Other (please specify)
+ 20 Academic Support for the Course Academic support for the course is provided via LMS, where students can find: guidelines and recommendations for doing the course; guidelines and recommendations for self-study; samples of assessment materials Facilities, Equipment and Software Computer (notebook) with Internet access; projector; white board Course Instructor Olesya Volchenko
Intended Learning Outcomes (ILO) Delivering Programme ILO(s)
Course ILO(s)
Teaching and Learning Methods for delivering ILO(s) Indicative Assessment Methods
Students are able to reflect (assess and develop) on learnt scientific methods and activities (Способен рефлексировать (оценивать и перерабатывать) освоенные научные методы и способы деятельности) Students are able to critically assess their own and other peoples’ presentations Students are able to analyze audience, purposes and outcomes of their presentation Students are able to improve their presentations based on the content of the course Students are able to recreate different formats of data visualization based on their own data and interests Lectures, interactive seminars, analysis of existing presentations and videos (i.e. TED Talks) Final exam presentation and essay; essay on selected TED talk; Improvement of a bad slide; short presentations Students know how to
process and able to manage it. (Способен организовать многостороннюю коммуникацию и управлять ею) Students know major techniques of creating presentation Students know major graphical formats and understand their pros and cons Students know different formats of data visualization Students knows major techniques in
- vercoming psychological issues in
giving talks and presentation Lecture, home reading, interactive seminars. Final exam presentation and essay; Quiz, Improvement of a bad slide; short presentations
SLIDE 4
Annex 1
Course Content
Introduction to public speaking General idea of public speaking Why should we do public speeches? Aims of public speeches Types of speakers Types of speeches Presentation check-list Psychological issues in giving presentations Who is your audience? Major issues in giving talks Tips and tricks in overcoming psychological issues Charts: bad and good Types of charts Titles and text Composition, time, relationships and space Colors Storytelling What is storytelling Examples of good storytelling How to create a story? How to use a story in your presentation? Technical details of graphics and fonts Major graphical formats Vector vs. Raster Types of fonts Licenses for fonts and images Presentation software: powerpoint, prezi, latex Powerpointless Alternatives to PowerPoint Prezi: why and when Latex, beamer: why and when Place, time, audience Organization of your presentation How to measure time during your presentation? How to adapt during your presentation? Popular science: how to deliver your research to general audience Techniques to persuade your audience Translation from scientific language Dealing with questions
SLIDE 5
Assessment Methods Types of Assessment Forms of Assessment Modules 1 2 3 4 Formative Assessment Test * Essay * Report/Presentation * Project * In-class Participation * Summative Assessment Exam *
SLIDE 6
Assessment Criteria In-class Participation
Grades Assessment Criteria «Excellent» (8-10) Ability to provide useful comment and thought-provoking question, valuable contribution to the discussion. A critical analysis which demonstrates original thinking and shows strong evidence of preparatory research and broad background knowledge. Excellent oral expression. «Good» (6-7) Ability to provide useful comment and thought-provoking question, valuable contribution to the discussion. «Satisfactory» (4-5) Questions and comments showing only rudimentary knowledge on the topic «Fail» (0-2) No class participation/ arbitrary comments / trivial questions.
TED talk essay
Grades Assessment Criteria «Excellent» (8-10) A well-structured essays showing ability to summarize video talk. Student provides critical points and reflects how the content of the course corresponds to selected talk. Student clearly develops his/her argument, the text is well-structured and clearly-written. «Good» (6-7) A well-structured essays showing ability to summarize video talk, however, the essay lacks critical points and reflects how the content of the course corresponds to selected talk. Student develops his/her argument with minor flaws, the text is well-structured and clearly- written. «Satisfactory» (4-5) An essay has obvious flaws in its structure, only main features of the video are summarized without any mistakes. The essay lacks critical points, but clearly reflects how the content of the course corresponds to selected talk. Student develops his/her argument with flaws, the text is well-structured and clearly-written. «Fail» (0-2) Fails to demonstrate skills in summarizing and assessing video talk.
Quiz
Grades Assessment Criteria «Excellent» (8-10) 85 – 100 % of correct answers «Good» (6-7) 65 – 84 % of correct answers «Satisfactory» (4-5) 45 – 64 % of correct answers «Fail» (0-2) 0 – 44 % of correct answers
Improvement of a bad slide
Grades Assessment Criteria «Excellent» (8-10) Student reframed content of the slide for better delivery. Both conceptual and visual components have been significantly improved.
SLIDE 7
«Good» (6-7) Student reframed content of the slide for better delivery. Conceptual component have been partly improved, visual components have been significantly improved. «Satisfactory» (4-5) Only visual issues have been fixed. «Fail» (0-2) Student failed to improve the slide.
Final exam
Grades Assessment Criteria «Excellent» (8-10) Student is able to deliver a clear presentation and analyze it according to course content. «Good» (6-7) Student is able to deliver a clear presentation but only partly analyze it according to course content. «Satisfactory» (4-5) Student is able to deliver a decent presentation and only partly analyze it according to course content. «Fail» (0-2) Student failed to deliver a decent presentation and analyze it according to course content.