
SLIDE 1
Source: GeoVille for World Bank
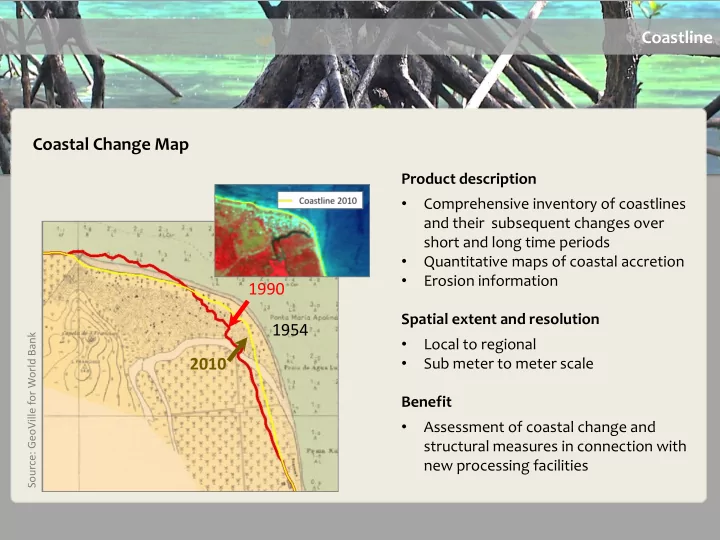
Coastline Coastal Change Map 1954 2010 1990
Product description
- Comprehensive inventory of coastlines
and their subsequent changes over short and long time periods
- Quantitative maps of coastal accretion
- Erosion information
Spatial extent and resolution
- Local to regional
- Sub meter to meter scale
Benefit
- Assessment of coastal change and