
SLIDE 1
Coastal Neighbourhoods
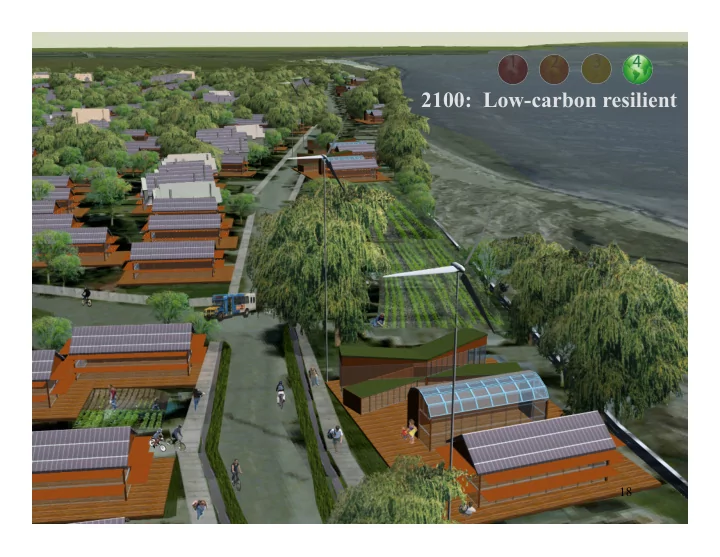
Existing Condition 2100: Storm surge (3.48m) 2100: Wall Adaptation 2100: Dike Adaptation 2100: Low-carbon resilient
18
Coastal Neighbourhoods 2100: Low-carbon resilient 2100: Dike - - PowerPoint PPT Presentation
Coastal Neighbourhoods 2100: Low-carbon resilient 2100: Dike Adaptation 2100: Wall Adaptation Existing 2100: Storm surge Condition (3.48m) 18 Capital Cost of UBC Buildings $120,000,000 Total Construction Cost (2011 $100,000,000 UBC
18
$0 $20,000,000 $40,000,000 $60,000,000 $80,000,000 $100,000,000 $120,000,000
50,000 100,000 150,000 200,000 250,000 300,000
Total Construction Cost (2011 dollars)
Floor Area (sq.ft)
UBC comparable buildings CIRS
10000000 20000000 30000000 40000000 50000000 Best Practice (LEED Gold) Beyond Best Practice (CIRS)
CDN$ NPV 2011
Capital Renewal Operating Costs Construction Cost (2011)
50 40 30 20 10
20 40 60 80 100 SUB CIRS
Proper Disposal (%) Location
1 2 3 4 5 General SUB CIRS
Ratings of Environmental Consciousness Location
0.5 1 1.5 2 2.5
Picture Icon
Sensitivity Index (d')
Image Type
500 1000 1500 2000 2500 3000
Just Yes Yes/no
Inverse Efficiency Score Sign Type
Integration
~14 million sq. ft. ~270 core buildings ~ 300 hectares
20 40 60 80 100
2007 2015 2020 2050
33% GHG Reduction
67% GHG Reduction
100% GHG Reduction
Steam to Hot water conversion (start) (17%) Continuous Optimization; BC Hydro Self-Sufficiency (6.5%) Continuous Optimization; Pulse Energy (10%) 8.5MW Clean Energy: Biomass II, Triumf? (23%) Steam to Hot water conversion (completion) (5%)
New Buildings: energy neutral Extend District Heating system to all campus buildings New clean energy sources: Ocean, Waste, Aquifer?
Bioenergy R&D Project (9%)
Continuous Optimization Transport changes
New Buildings: Low temperature; energy neutral New Buildings: Low temperature and energy Smart Energy System
Supply: Demand: