
SLIDE 1
Cloud-based Log Analysis and Visualization
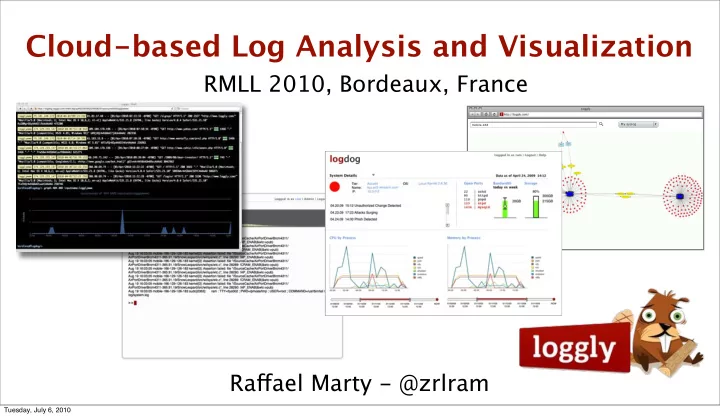
mobile-166 My syslogRMLL 2010, Bordeaux, France Rafgael Marty - @zrlram
Tuesday, July 6, 2010
Cloud-based Log Analysis and Visualization RMLL 2010, Bordeaux, - - PowerPoint PPT Presentation
Cloud-based Log Analysis and Visualization RMLL 2010, Bordeaux, France My syslog mobile-166 Ra fg ael Marty - @zrlram Tuesday, July 6, 2010 Ra fg ael (Ra fg y) Marty Founder @ Chief Security Strategist and Product Manager @ Splunk
RMLL 2010, Bordeaux, France Rafgael Marty - @zrlram
Tuesday, July 6, 2010
(c) by Rafgael Marty
Logging as a Service
2
Applied Security Visualization
Publisher: Addison Wesley (August, 2008) ISBN: 0321510100
Tuesday, July 6, 2010
(c) by Rafgael Marty
Logging as a Service
3
Tuesday, July 6, 2010
(c) by Rafgael Marty
Logging as a Service
4 Tuesday, July 6, 2010
(c) by Rafgael Marty
Logging as a Service
5 Tuesday, July 6, 2010
(c) by Rafgael Marty
Logging as a Service
6
Tuesday, July 6, 2010
(c) by Rafgael Marty
Logging as a Service
A picture is worth a thousand log records.
Inspire
Pose a New Question
Explore and Discover
Support Decisions
Communicate Information
Increase Efficiency Answer a Question
7 Tuesday, July 6, 2010
Tuesday, July 6, 2010
(c) by Rafgael Marty
Logging as a Service
9
Process Visualize
Collect
Tuesday, July 6, 2010
Tuesday, July 6, 2010
(c) by Rafgael Marty
Logging as a Service
11
Tuesday, July 6, 2010
Tuesday, July 6, 2010
(c) by Rafgael Marty
Logging as a Service
13
Oct 13 20:00:43.874401 rule 193/0(match): block in on xl0: 212.251.89.126.3859 >: S 1818630320:1818630320(0) win 65535 <mss 1460,nop,nop,sackOK> (DF) Oct 13 20:00:43 fwbox local4:warn|warning fw07 %PIX-4-106023: Deny tcp src internet: 212.251.89.126/3859 dst 212.254.110.98/135 by access-group "internet_access_in" Oct 13 20:00:43 fwbox kernel: DROPPED IN=eth0 OUT= MAC=ff:ff:ff:ff:ff:ff:00:0f:cc: 81:40:94:08:00 SRC=212.251.89.126 DST=212.254.110.98 LEN=576 TOS=0x00 PREC=0x00 TTL=255 ID=8624 PROTO=TCP SPT=3859 DPT=135 LEN=556
Tuesday, July 6, 2010
(c) by Rafgael Marty
Logging as a Service
“To analyze or separate (input, for example) into more easily processed components.” (answers.com)
14
/(\d{1,3}\.\d{1,3}\.\d{1,3}\.\d{1,3})/g
Tuesday, July 6, 2010
Tuesday, July 6, 2010
(c) by Rafgael Marty
Logging as a Service
16 Tuesday, July 6, 2010
(c) by Rafgael Marty
Logging as a Service
17
Tuesday, July 6, 2010
(c) by Rafgael Marty
Logging as a Service
18
http://www.highcharts.com/
Tuesday, July 6, 2010
(c) by Rafgael Marty
Logging as a Service
19
http://code.google.com/apis/visualization/interactive_charts.html
Tuesday, July 6, 2010
(c) by Rafgael Marty
Logging as a Service
20
http://vis.stanford.edu/protovis/
Tuesday, July 6, 2010
(c) by Rafgael Marty
Logging as a Service
21
http://thejit.org/
Tuesday, July 6, 2010
(c) by Rafgael Marty
Logging as a Service
22
http://processing.org/ http://processingjs.org/
Tuesday, July 6, 2010
Tuesday, July 6, 2010
(c) by Rafgael Marty
Logging as a Service
24
Tuesday, July 6, 2010
Tuesday, July 6, 2010
(c) by Rafgael Marty
Logging as a Service
What it is
It’s not
26
Types
Benefits
Tuesday, July 6, 2010
(c) by Rafgael Marty
Logging as a Service
27
Tuesday, July 6, 2010
(c) by Rafgael Marty
Logging as a Service
Data Sources Clients
API Proxies
Distributed data store Distributed indexing and processing Data collection Data access
mobile-166 My syslogLoggly user interface
Indexers and Search Machines
28 Tuesday, July 6, 2010
(c) by Rafgael Marty
Logging as a Service
http://<subdomain>.loggly.com/api/<resource>
29
http://loggly.loggly.com/api/search/?q=error User: guest / Password: loggly
http://wiki.loggly.com/api-documentation
HTTP Based
syslog to: logs.loggly.com:514
Tuesday, July 6, 2010
(c) by Rafgael Marty
Logging as a Service
http://[domain].loggly.com/api/search?q=404
30
{ "data": [ { "indexed": "2010-07-03T17:17:38.909Z", "ip": "75.101.249.172", "text": "Oct 13 20:00:38.018152 rule 57/0(match): pass in on xl1: 195.141.69.45.1030 > 62.2.32.250.53: 34388 [1au]
[|domain] (DF)",
"inputname": "logglyweb", "timestamp": "2010-07-03 10:17:38" }, { "indexed": "2010-07-03T17:17:37.879Z", "ip": "75.101.249.172", "text": "Oct 13 20:00:38.115862 rule 57/0(match): pass in on xl1: 195.141.69.45.1030 > 192.134.0.49.53: 49962 [1au]
[|domain] (DF)",
"inputname": "logglyapp", "timestamp": "2010-07-03 10:17:37" }, ...
Tuesday, July 6, 2010
(c) by Rafgael Marty
Logging as a Service
Oct 13 20:00:38.018152 rule 57/0(match): pass in on xl1: 195.141.69.45.1030 > 62.2.32.250.53: 34388 [1au][|domain] (DF) Oct 13 20:00:38.115862 rule 57/0(match): pass in on xl1: 195.141.69.45.1030 > 192.134.0.49.53: 49962 [1au][|domain] (DF) Oct 13 20:00:38.157238 rule 57/0(match): pass in on xl1: 195.141.69.45.1030 > 194.25.2.133.53: 14434 [1au][|domain] (DF)
31
(.*) rule ([-\d]+\/\d+)\(.*?\): (pass|block) (in|out) on (\w+): (\d+\.\d+\.\d+\.\d+)\.?(\d*) [<>] (\d+\.\d+\.\d+\.\d+)\.?(\d*): (.*)
Oct 13 20:00:38.018152,57/0,match,pass,in,xl1,195.141.69.45,1030,62.2.32.250,53,34388 [1au][|domain] (DF) Oct 13 20:00:38.115862,57/0,match,pass,in,xl1,195.141.69.45,1030,192.134.0.49,53,49962 [1au][|domain] (DF) Oct 13 20:00:38.157238,57/0,match,pass,in,xl1,195.141.69.45,1030,194.25.2.133,53,14434 [1au][|domain] (DF)
Raw Normalized (CSV) Regex / Parser
Tuesday, July 6, 2010
(c) by Rafgael Marty
Logging as a Service
32
CSV file
AfterGlow
Graph file
Parser Grapher
digraph structs { graph [label="AfterGlow 1.5.8", fontsize=8]; node [shape=ellipse, style=filled, fontsize=10, width=1, height=1, fixedsize=true]; edge [len=1.6]; "aaelenes" -> "Printing Resume" ; "abbe" -> "Information Encryption" ; "aanna" -> "Patent Access" ; "aatharuv" -> "Ping" ; }
Configuration
color.source=“green” if ($fields[0] ne “d”) cluster.target=regex_replace("(\\d\+)\\.")."/8" threshold.event=5 size.target=$fields[1]
Tuesday, July 6, 2010
(c) by Rafgael Marty
Logging as a Service
33
Grapher
Loggly JSON CSV DOT Graph
Tuesday, July 6, 2010
(c) by Rafgael Marty
Logging as a Service
34 Tuesday, July 6, 2010
(c) by Rafgael Marty
Logging as a Service
35
<script type="text/javascript"> google.load('visualization', '1', {'packages':['motionchart', 'table', 'annotatedtimeline']}); google.setOnLoadCallback(call); var trends = new Array(); function call() { $.ajax({ url: "http://logdog.loggly.com/api/search/?q=404&facets=True&buckets=100", type:'GET', dataType: 'jsonp', username: 'xxxxx', password: 'xxxxxx', success: function(data) { trends = data.data drawChart(); } }); } function drawChart() { var data = new google.visualization.DataTable(); data.addColumn('string', 'Search'); data.addColumn('datetime', 'Date'); data.addColumn('number', 'Count'); data.addRows(trends); var chart = new google.visualization.MotionChart(document.getElementById('chart_div')); chart.draw(data, {width: 600, height:300, state:state}); var view = new google.visualization.DataView(data); view.setRows(view.getFilteredRows([{column: 1, minValue: new Date(2007, 0, 1)}])); var table = new google.visualization.Table(document.getElementById('test_dataview')); table.draw(view, {sortColumn: 1}); var time = new google.visualization.AnnotatedTimeLine(document.getElementById('timeline')); time.draw(timedata, {displayAnnotations: true}); } </script>
Tuesday, July 6, 2010
Tuesday, July 6, 2010
(c) by Rafgael Marty
Logging as a Service
bright spots
37 Tuesday, July 6, 2010
(c) by Rafgael Marty
Logging as a Service
38 Tuesday, July 6, 2010
(c) by Rafgael Marty
Logging as a Service
Port Source IP Destination IP
39 Tuesday, July 6, 2010
Tuesday, July 6, 2010
(c) by Rafgael Marty
Logging as a Service
Share, discuss, challenge, and learn about security visualization.
41
Tuesday, July 6, 2010
(c) by Rafgael Marty
Logging as a Service
Chapters
42
Addison Wesley (August, 2008) ISBN: 0321510100
Tuesday, July 6, 2010
43
rafgael.marty@loggly.com @zrlram
Tuesday, July 6, 2010