
SLIDE 1
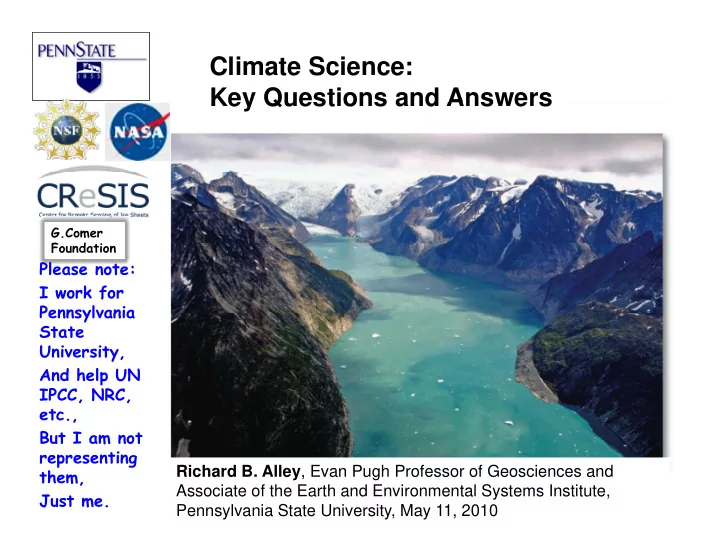
Climate Science: Key Questions and Answers Key Questions and Answers
G.Comer F d Foundation
Please note: I work for Pennsylvania Pennsylvania State University, And help UN p IPCC, NRC, etc., But I am not ti representing them, Just me. Richard B. Alley, Evan Pugh Professor of Geosciences and Associate of the Earth and Environmental Systems Institute, Pennsylvania State University, May 11, 2010