
SLIDE 1
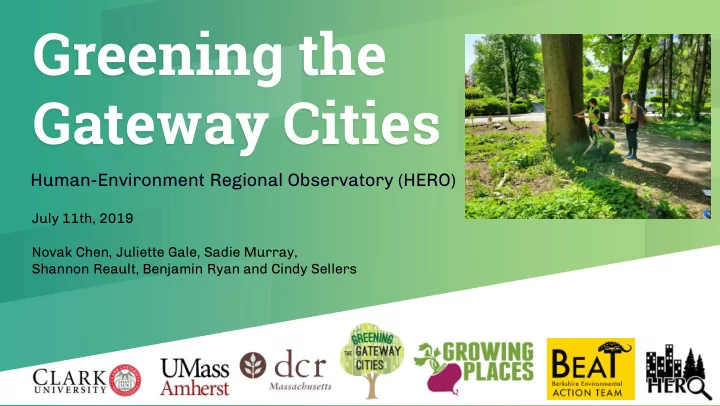
Greening the Gateway Cities
Human-Environment Regional Observatory (HERO)
July 11th, 2019 Novak Chen, Juliette Gale, Sadie Murray, Shannon Reault, Benjamin Ryan and Cindy Sellers
Greening the Gateway Cities Human-Environment Regional Observatory - - PowerPoint PPT Presentation
Greening the Gateway Cities Human-Environment Regional Observatory (HERO) July 11th, 2019 Novak Chen, Juliette Gale, Sadie Murray, Shannon Reault, Benjamin Ryan and Cindy Sellers Meet the Research Team Under dergraduate aduate Research
Human-Environment Regional Observatory (HERO)
July 11th, 2019 Novak Chen, Juliette Gale, Sadie Murray, Shannon Reault, Benjamin Ryan and Cindy Sellers
Under dergraduate aduate Research earch Cohort Novak Chen, Juliette Gale, Sadie Murray, Shannon Reault, Benjamin Ryan and Cindy Sellers Graduate aduate Mentor tors Nicholas Geron and Marc Healy Directo ectors Deborah Martin and John Rogan
From left to right: Sadie, Cindy, Juliette, Ben, Novak, Shannon 2
Introduction
Program
Gateway Cities
Tree Survey
Interview Response
Conclusions
Response
3
The HERO Program:
HERO’s 20th Year
Undergraduate-graduate-faculty experience researching human- environment relationships in Massachusetts Current Research Focus:
What We Do:
during academic year
2014 HERO Fellow looking at an Asian Longhorned Beetle 2015 HERO Fellows Working in the HERO Lab 2018 HERO Fellows conducting an interview with Fall River community member 2017 HERO Fellows conducting field work
4
Greening the Gateway Cities Program (GGCP)
The goal of the GGCP is to increase tree canopy cover in Massachusetts’ Gateway Cities to increase energy efficiency in urban residential areas. Target Areas:
Neighborhoods
5
Monument Square, Leominster Center Park Square, Pittsfield Center
Pittsfield Leominster
Google 2017 Google 2018
6
Characteristics of Leominster
Populatio ion: 41,823 Median Househol
Massach chuset etts: $74,167 Demographic ic Distrib ibution ion: White: 83.3 % Black or African American: 5.3 % American Indian and Alaska Native: 0.1% Asian: 3% Two or more races: 3% Hispanic or Latino: 17.8% White alone, not Hispanic or Latino: 71.6% Education ion: 25 years or older with BA or higher: 28.1 % Massach chuset etts: 42.1%
7
U.S. Census Bureau. (2018, July 1)
Characteristics of Pittsfield
Populatio ion: 42,533 Median Household
Massach chuset etts: $74,167 Demographic ic Distrib ibution ion: White: 87.4 % Black or African American: 4.7 % American Indian and Alaska Native: 0.4% Asian: 2% Two or more races: 3.5% Hispanic or Latino: 6% White alone, not Hispanic or Latino: 84.4% Education ion: 25 years or older with BA or higher: 28.1 % Massach chuset etts: 42.1%
8
U.S. Census Bureau. (2018, July 1)
Leominster Tree Planting Locations
Total DCR Trees Planted ed: 1920 trees
First Plantin ings: Spring 2016
Trees Surveye yed: 45.16% of planted
al: 867 trees
ate: 436 trees
lic: 431 trees
Canop
y Cover
ywide: 64.22%
ing Zone: 38.43%
Impervi vious Surface ce
wide: 17.09%
ing Zone: 47.06% 9
Pittsfield Tree Planting Locations
Total DCR Trees Planted ed: 1870 trees
First Plantin ings: Spring 2016
Trees Surveye yed: 49.52% of trees planted
al: 926 trees ○ Privat ate: 577 trees ○ Public lic: 349 trees
Canop
y Cover
ywide: 56.80%
ing Zone: 27.16%
Impervi vious Surface ce
wide: 13.23%
ntin ing Zone: 48.56% 10
Inter ervi views:
implemented?
the program? Tree Survey: y:
planted in Leominster and Pittsfield?
the two cities?
11
What are the biophysical factors and the social networks that influence tree health in the GGC program? How does tree health in 2019 compare to previous HERO results?
Introduction
Program
Gateway Cities
Tree Survey
Interview Response
Conclusions
Response
12
All GGC Trees in City All Public Trees Private Trees # of Trees per Property 0 - 20% 20 Properties 21% - 40% 20 Properties 41% - 60% 20 Properties 61% - 80% 20 Properties 81% - 100% 20 Properties
Eastern Redbud White Fir
13
14
Mortality Vigor Site Type Land Use Height DBH Width Distance to Impervious
American Elm American Elm Western Red Cedar Japanese Tree Lilac
15
16
BR NC
607082 5/13/2017 Marc Healy Liriodendron tulipifera ‘Fastigiata’ 999-999-9999 Pittsfield 133 Fenn Street 6/4/2019 SP SFR-D 1.2 54 3 5 4 4 2 2 1 8 11 6 Resident came over and asked how trees were doing Some bark damage
Alive Standing Dead Removed Stump Unknown
Crabapple Kentucky Coffee Kentucky Coffee Tulip Tree
17
1 Healthy 2 Slightly Unhealthy 3 Moderately Unhealthy 4 Severely Unhealthy 5 Dead
Cornelian Cherry Dogwood River Birch Tulip Tree Ware Oak Japanese Snowbell
18
Front Yard Back Yard Sidewalk Planting Strip Maintained Park Other Maintained
European Hornbeam Ware Oak American Elm Faser Fir American Hornbeam
19
Single Family Residential
Attached/Detached
Multi-Family Residential Maintained Park Commercial Institutional
Tulip Tree Persian Ironwood Black Gum Japanese Tree Lilac Sargent Crabapple
20
Genus distribution in Leominster and Pittsfield
21
Genus distribution in Leominster
22
Genus distribution in Pittsfield
23
88% 6% <1% 3% 3%
24
Cities Alive % Holyoke 78% Chelsea 86% Fall River 92% Chicopee 92%
Alive Removed Stump Standing Dead Unknown
90% 6% <1% 2% 2%
Alive 100% (777)
Healthy 1 Slightly unhealthy 2 Moderately unhealthy 3 Severely unhealthy 4 79.3% (616) 12.9% (100) 3.6% (28) 4.2% (33)
Alive Removed Stump Standing Dead Unknown
25
87% 5% <1% 3% 5%
Alive 100% (801) Healthy 1 Slightly unhealthy 2 Moderately unhealthy 3 Severely unhealthy 4 80.9% (648) 10.5% (84) 5.0% (40) 3.6% (29)
Alive Removed Stump Standing Dead Unknown
26
Leominster Pittsfield
27% 24% <1% 20% 6% <1% 22% 1% 33% 19% <1% 31% <1% <1% 1% 16%
27
Back Yard Front Yard Median Maintained Park Natural Area Other Maintained Landscaped Area Sidewalk Cutout Sidewalk Planting Strip Side Yard
Leominster Pittsfield
28
Commercial Institutional Maintained Park Multi-Family Residential Single-Family Residential—Attached Single-Family Residential—Detached Vacant Lot
5% 11% 10% 11% 13% 49% 1% 3% 9% 9% 20% 15% 44%
Mortality Vigor
29
15% 25% 35% 45% 55% 65% 75% 85% 95% BY FY MP OM SC SP Alive Removed Stump Standing Dead Unknown 15% 25% 35% 45% 55% 65% 75% 85% 95% BY FY MP OM SC SP 1 2 3 4 5
534 385 459 54 12 342 467 359 410 49 12 328
Mortality Vigor
30 75 175 170 254 830 11 70 149 159 238 252 11
752 278
60% 65% 70% 75% 80% 85% 90% 95% 100% COMM INST MP SFR-A SFR-D MFR V Alive Removed Stump Standing Dead Unknown 60% 65% 70% 75% 80% 85% 90% 95% 100% COMM INST MP SFR-A SFR-D MFR V 1 2 3 4 5
Mortality Vigor
31 168 1140 323
60% 65% 70% 75% 80% 85% 90% 95% 100% Evergreen Shade Fruit/Ornamental 1 2 3 4 5
189 1262 342
60% 65% 70% 75% 80% 85% 90% 95% 100% Evergreen Shade Fruit/Ornamental Alive Removed Stump Standing Dead Unknown p-value: 0.0028 p-value: 0.0000
Mortality Vigor
32 996 780 17
60% 65% 70% 75% 80% 85% 90% 95% 100% Native Non-native Hybrid / Unknown Alive Removed Stump Standing Dead Unknown 60% 65% 70% 75% 80% 85% 90% 95% 100% Native Non-Native Hybrid / Unknown 1 2 3 4 5
894 721 16
p-value: 0.1117 p-value: 0.0855
Genus N Survivorship Mean Vigor Acer 137 89.1% 1.20 Quercus 119 89.1% 1.35 Liriodendron 97 82.5% 1.45 Carpinus 92 89.1% 1.68 Liquidambar 76 76.3% 1.98 Amelanchier 70 95.7% 1.36 Ginkgo 69 84.1% 1.32 Malus 66 95.5% 1.13 Thuja 66 81.8% 1.28 Cercidiphyllum 65 87.7% 1.24
33
Red Maple Scarlet Oak
Genera with a 100% Survival Rate
Birch n=53 Cherry / Plum (prunus) n=44 Yellowwood n=24 Witch-hazel n=19 Dawn redwood n=17
34
Program-Wide Trees with Lowest Survivorship
Ironwood 76.9% n=13 Sweetgum 76.3% n=76 Tupelo 72.9% n=59 Bald cypress 60.0% n=25 Silverbell 22.2% n=9
35
Distance to Impervious Surfaces (DIMPS) Vigor of Residential Trees
79 110 640
36
0% 10% 20% 30% 40% 50% 60% 70% 80% 90% 100% DIMPS 0 - 5 ft. DIMPS 5-10 ft. DIMPS 10+ ft. Healthy (1) Slightly Healthy (2) Moderately Unhealthy (3) Severely Unhealthy (4) Standing Dead (5) p-value: 0.0198
Impervious Surface Vigor of Non-Residential Trees
309 101 391
37
0% 10% 20% 30% 40% 50% 60% 70% 80% 90% 100% DIMPS 0 - 5 ft. DIMPS 5-10 ft. DIMPS 10+ ft.
Healthy (1) Slightly Healthy (2) Moderately Unhealthy (3) Severely Unhealthy (4) Standing Dead (5)
p-value: 0.1192
Impervious Surface Mortality of Maintained Areas and Street Trees
60% 65% 70% 75% 80% 85% 90% 95% 100% Maintained Area Street Trees Alive Removed Stump Standing Dead Unknown 532 359
38
p-value: 0.0012
Survi vivo vorship ship
than Pittsfield
unknowns in Pittsfield
Leominster display more even distribution
Characteri acteristi stics cs
have significantly lower survivorship
significantly higher vigor
significant for mortality or vigor
39
Locati ation
both cities
have lower vigor
than other maintained trees
Leominster DCR tree planting team
Introduction
Program
Gateway Cities
Tree Survey
Interview Response
Conclusions
Response
40
Inter ervi views:
implemented?
the program?
41
What are the biophysical factors and the social networks that influence tree health in the GGC program? How does tree health in 2019 compare to previous HERO results?
UMass graduate student Joana and HERO Fellow Novak interviewing resident in Pittsfield
148 Property owners called 33 Scheduled property owner interviews 50 Interviews Conducted
42 (Right): HERO Fellows Sadie and Shannon ask a resident about their tree preferences at their home in Pittsfield. (Left): HERO Fellows Sadie and Ben interview the Leominster community partner at a farmers market in Fitchburg.
Organizations & Agencies Interviewed
Leominster
Pittsfield
Team (BEAT)
43
0% 10% 20% 30% 40% 50% 60% 70% 80% 90% 100% White Black Asian Hispanic or Latino
Pittsfield Average Pittsfield Interviewees Leominster Average Leominster Interviewees
44
median income in Leominster, 80-95% in Pittsfield)
and Pittsfield
45
Actors
actors who participate in policy decision making
Resources
distributed led to differentiations in power
Rules s of the Game
procedures of implementation
Discourse ses
understanding of the world / the environment
46
Park & Youn. 2013
City DCR Community Partner Housing Authority Businesses Residents Foresters plant and steward some trees Supplies information and resources Marketing and community outreach Steward trees Steward trees Steward trees
47
City DCR Community Partner Housing Authority Businesses Residents Foresters plant and steward some trees Supplies information and resources Marketing and community
Steward trees Steward trees Steward trees
“[people] which may not may not neces essari sarily y interact eract with h city ty governme ernment nt, they’ll interact with the Spani anish sh center er and [... The Spanish American Center] pushe hes s that stuff, all the informa rmati
they’re so willing to do it and they’re good at it.” (Leominster City)
48
City DCR Community Partner Housing Authority Businesses Residents Foresters plant and steward some trees Supplies information and resources Marketing and community
Steward trees Steward trees Steward trees
“So you know, and the mayo yor r is just t like e never er stops ps talking ng about ut this so everybody knows about the program because he just, he does two, he does s a radi dio show w every y week ek and d a TV show w every ry week ek on local al peopl ple e and it's s always ways in his book, "Don' n't t forget et to get your ur free e tree! e!" and he's like holding it up to the screen, "free tree, call" you know "it's a 617 number but they're right in Leominster!” (Leominster City)
49
City DCR Community Partner Housing Authority Businesses Residents Foresters plant and steward some trees Supplies information and resources Marketing and community
Steward trees Steward trees Steward trees
“So when you’re on a landlord
tenant, they can’t give permission to plant the tree, so then you have to reach ch the landl dlord […] we want t to focus us on renters ters like rental tal property perty
ers.” (Leominster Community Partner) “There's a lot of other people that t are not involved ved, who shoul uld be involved
[...] there's not enough youth th program ams out here” (Resident)
50
City DCR Community Partner Housing Authority Businesses Residents Foresters plant and steward some trees Supplies information and resources Marketing and community
Steward trees Steward trees Steward trees
“The DCR makes es a flier er that goes out, we’ll take the flier and we’ll make it a little more promotab table, and we’ll make it a litt ttle e more re acces essib sible to the
trans nslate ate thing ngs s into Spani panish sh, and that’s a huge percentage
Leominster, so it’s really impo port rtant ant that t we do that t for acces essi sibility ty as well.” (Leominster Community Partner)
51
City DCR Community Partner Housing Authority Businesses Residents Foresters plant and steward some trees Steward trees Steward trees Steward trees
Tulip Tree Japanese Stewartia
52
Actors
“I think [my neighbors] don’t take trees ‘cause they’re
they don’t really ly have yards.” (Resident) “Businesses are usually not gonna take time out of the day to water the trees, , so the DCR was doing ng it [...] the DCR was able to— and this s is specif ific ic to Leomin inst ster—but they were able to water the trees, s, because they had capacity to the first couple of years [...] So in terms of maintenance, when they’re able to do that, obviously it’s the most
able to do that, it’s really about then us also
ing helpers s in the communi nity.” (Leominster Community Partner) “The woman who does the flowers takes s care of [the street trees] s]. She goes around and they have people le on the weekends s who do it, and take this s water truck k and go water trees s and plants, and everything else.” (Leominster City) There’s one retired arborist who goes around and does it on his
the younger city trees […] withou hout him there's s nobod
ly to do the follow
going to need pruning. We’re doing that in the in-betwe ween seasons, we’re going around and checkin ing on the trees. Pruning up, restaking, whatever needs to be done. But, when we’re gone that’s going to disappear.” (Pittsfield Foresters) 53
Resources urces
“The foresters don’t have the capacit ity to water it, the people who live there are seniors and they don’t have the ability to water it. So we were goin ing to try to adopt those se trees s out to people le who are able so they y take care of a tree and then hopefully down the road we are going to get them be like this is
contests stuff like that get people le to connect to a c certai ain tree.” (Leominster Community Partner) “So that’s my concern is the public lic safety in terms s of dead ad trees s and prunin ing and take downs of pruning stuff. We just can’t keep up with it right ht now.” (Pittsfield City) “I don’t really do anything [besides daily watering]. Because they’re so young I I thought ht it was better to just let them grow w befor
pruni ning or anything like that. Plus I’m not that confident in the prunin ing anything [...] I was gonna do probably more resear arch or call [DCR] or find
w it says it in the guid ide but still I don’t want to just start clipping branches and I don’t want to hurt the tree” (Resident) “We gave them [DCR Foresters]
every day when they get phone calls they can just go right to the neighborhood and check it out.” (Leominster City) 54
Why do actors take or not take stewar ardsh ship ip of GGC trees? ? Discou course rse
55
2 4 6 8 10 12 14 16 18 20 Number of Responses
Why do actors take or not take stewar ardsh ship ip of GGC trees? ? Discou course rse
“It’s like the least I could ld do. Least I could do is try to help the environment, plant more trees. […] it’s like the people that have all the money you wish they would think like you did so they could help out the planet more doesn’t quite work like that but. .” (Resident) But it is well l worth h the time and money that he allowed wed us to spend. The trees alone [...] they’re beautifu iful l trees. (Pittsfield City) “I just feel, you know, trees man. You know, they were here befor
us human ans [...] if God had that much desire to create these other things, then they need to be respected just st the same way that us human an beings s should ld be respected.” (Resident) When the mayor was elected his philosophy [was] you never know who's coming into town. So
to be clean an, [...] look really ly nice. (Leominster City) “[I take care of my trees] because we need
need them for this [points to
tank]!” (Resident) “I love trees for several different reasons, you know what I mean? Whether it's just to catch some shade, whether it’s just to feel like, you know, I don't know, kind of country about things.” (Resident) 56
What are the informal and formal rules of steward rdsh ship ip of GGC trees? ? Rules s of the Game
“No one takes care of the trees. [The housi sing author horit ity] gets s mad when n residents s try to take care of the trees.” (Resident) “Water them and fertili ilize them, put mulch h around them. They told ld us to water every week. Accordin ing to the pamphle let they said 15 gallons per week for the first year.” (Resident) “People love their trees. You know they' y're mad when they can't get tree. So we kept a list because they always told them "it will expand“ so then we called those se people le back and said "you're in the area now" " and you would ld have thought ht they won the lottery. Free trees!” (Leominster City) 57
Again the people that have been offered trees s that could ld not normally lly afford d
“Every single resident I have talked to for this program loves it […] they love our
women I interviewed, she was like yeah one
the winter, I didn't even call them […] they came over and were like hey lets replace your tree, she didn't have to do anything.” (Leominster Community Partner) “They're the best thing in the world, they're free!” (Resident)
58
“One thing lacking in this program, the aftercare for the
follow-up program to take care
the city has nobody to maintain the trees.” (Pittsfield Foresters) “I think there’s never enough local awareness about these particular programs. I think, like I said, no matter what, there’s still gaps. You’re still not gonna be able to reach people [...] reaching people are always
Partner) “An elder may not be able to […] water the garden every day […] Businesses are usually not gonna take time out of the day to water the trees, so the DCR was doing it.” (Leominster Community Partner) “Leave ves s increase se the cleanup p as they grow. You can have branches that died and need to be taken down to prevent property damage. Definitely increases the care of your yard.” (Resident)
59
disconnected
60
Introduction
Program
Gateway Cities
Tree Survey
Interview Response
Conclusions
Response
61 61
Tree Survey: y:
Inter ervi views:
to: renters/landlords youth and unexpected actors
62
What are the biophysical factors and the social networks that influence tree health in the GGC program?
Survivorship average is in line with survivorship results for 2017 and 2018 Location ion
sidewalk trees Native ve Status
Tree Type
* Statistical test indicates significant findings
How does tree health in 2019 compare to previous HERO results?
63
property owners and underrepresented actors
street
foster diversity, minimize impacts of high individual genus mortality
64
65
Leaders and Volunteers from BEAT and Growing Places Resident and Stakeholder Interviewees Residents of Leominster and Pittsfield
City of Leominster:
City of Leominster Grant Office
City of Pittsfield:
Department of Community Development Department of Public Utilities Pittsfield Conservation Commission Department of Public Services
Administrative Support
Rachel Levitt Pamela Dunkle
DCR
Mat Cahill Larissa Parse Carolyn Streeter Jay Girard Yoni Glogower
U.S. Forest Service
Lara Roman
UMass Amherst
Theodore Eisenman Robert Ryan Alicia Coleman Joana Herculano
66 66
References
About the Gateway Cities. (n.d.). Retrieved July 10, 2019, from https://massinc.org/our-work/policy-center/gateway- cities/about-the-gateway-cities/ Greening the Gateway Cities Program. (n.d.). Retrieved July 10, 2019, from https://www.mass.gov/service-details/greening- the-gateway-cities-program Gross, D. A. (2015, October 9). Plastic Town. Retrieved June 20, 2019, from https://www.sciencehistory.org/distillations/plastic-town History of Pittsfield. (n.d.). Retrieved July 10, 2019, from https://www.cityofpittsfield.org/residents/history_of_pittsfield/index.php Park, M. S., & Youn, Y. C. (2013). Development of urban forest policy-making toward governance in the Republic of Korea. Urban forestry & urban greening, 12(3), 273-281. Seymour, R. B., & Kaufmann, G. B. (1992). The rise and fall of Celluloid. Journal of Chemical Education, 69(4), 311. https://doi.org/10.1021/ed069p311 Urban, J. (2016, January 5). Urban Design and Tree Planting Spaces [Web log post]. Retrieved July 10, 2019, from https://thefield.asla.org/2016/01/05/urban-design-and-tree-planting-spaces/ U.S. Census Bureau QuickFacts: Leominster city, Massachusetts. (n.d.). Retrieved July 10, 2019, from https://www.census.gov/quickfacts/fact/table/leominstercitymassachusetts/PST045218 U.S. Census Bureau QuickFacts: Pittsfield city, Massachusetts. (n.d.). Retrieved July 10, 2019, from https://www.census.gov/quickfacts/fact/table/pittsfieldcitymassachusetts/PST045218
67
68
69